Bitcoin Weekly Forecast: Bullish Bounce Or Bear Market Trap?
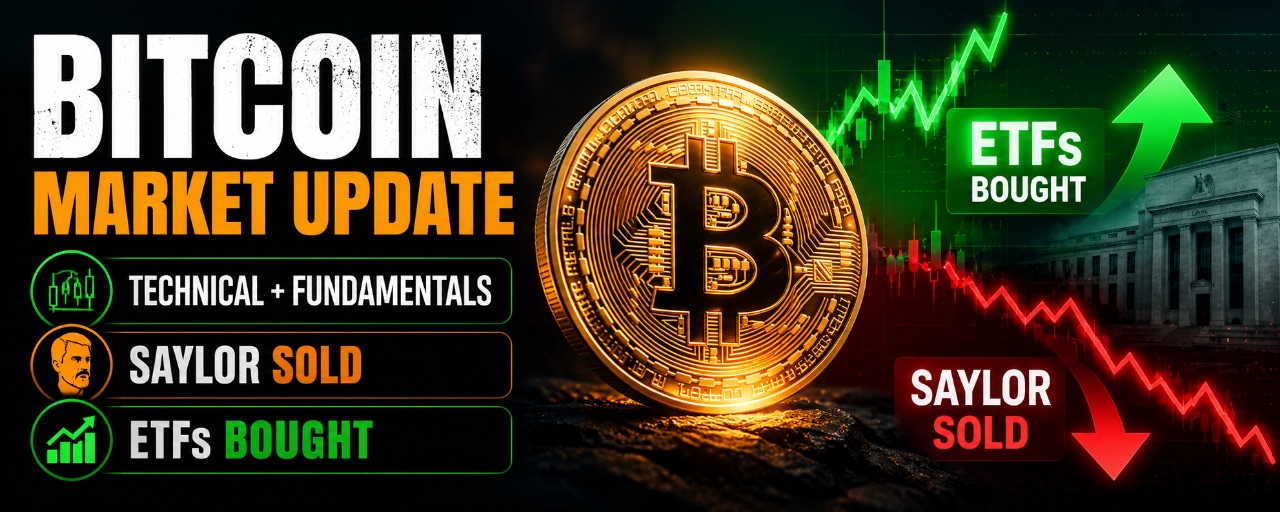
It is officially Q3 now, and the good news is that Bitcoin is already halfway through its bear market. Historically, Bitcoin bear markets have typically lasted around one year, and we are now 10 months into this one.
- ✓It is officially Q3, and Bitcoin is roughly 10 months into a bear market that has historically lasted about a year.
- ✓The monthly and weekly structure is still bearish, but price reclaimed $60k and swept the $59k low.
- ✓This bounce faces a cluster of resistance at $64.5k to $66k, then $70k to $72k.
- ✓Strategy sold 3,588 BTC, and spot ETFs just logged their first net inflow since June's record outflows.
Educational content only. Not financial advice. This article is general market commentary. It is not a recommendation to buy, sell or hold any asset.
01Where We Are In The Cycle
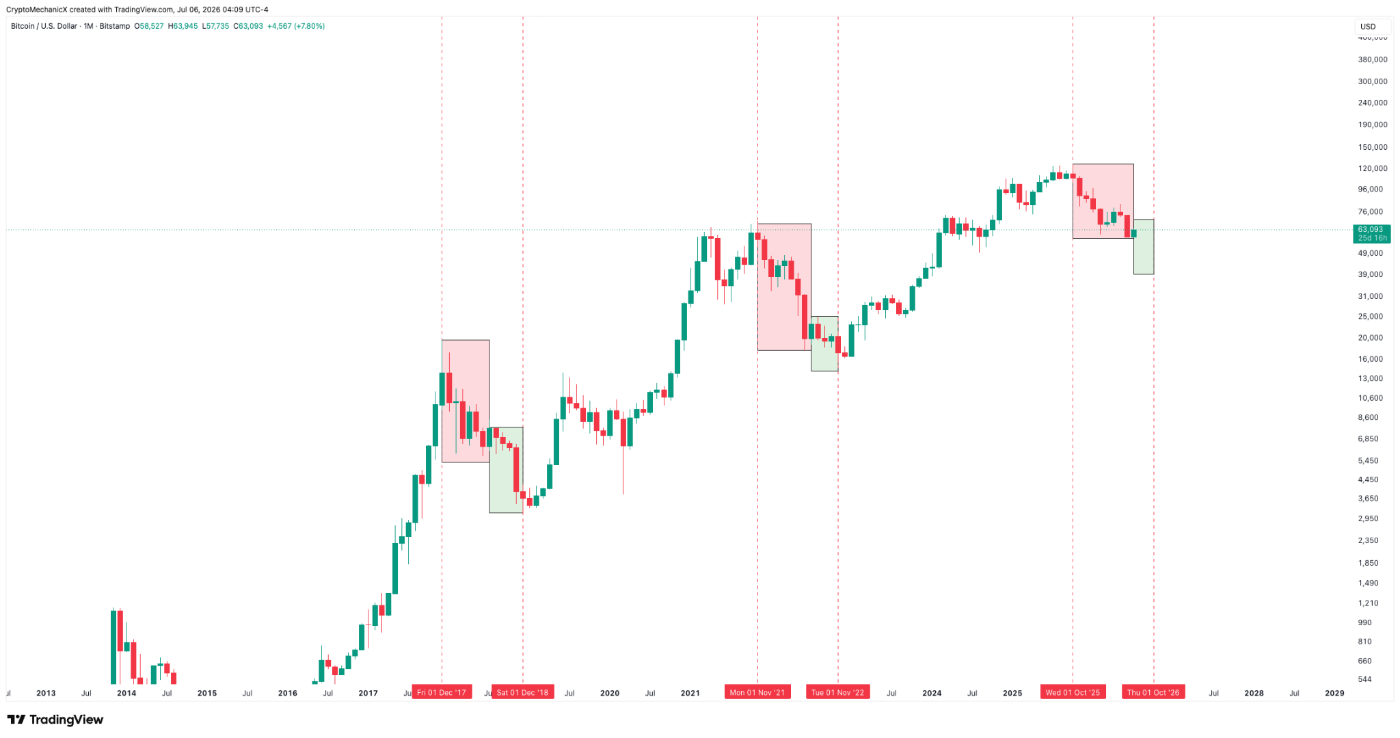
Based on previous bear markets, Q3 and Q4 are typically when things start to accelerate. This is the period when you start positioning yourself for the next bull market cycle.
We are not saying this on our own, this is simply how previous bear market cycles have played out. We have attached the chart below for reference. Now let's talk about the current picture.
02BTCUSD Monthly
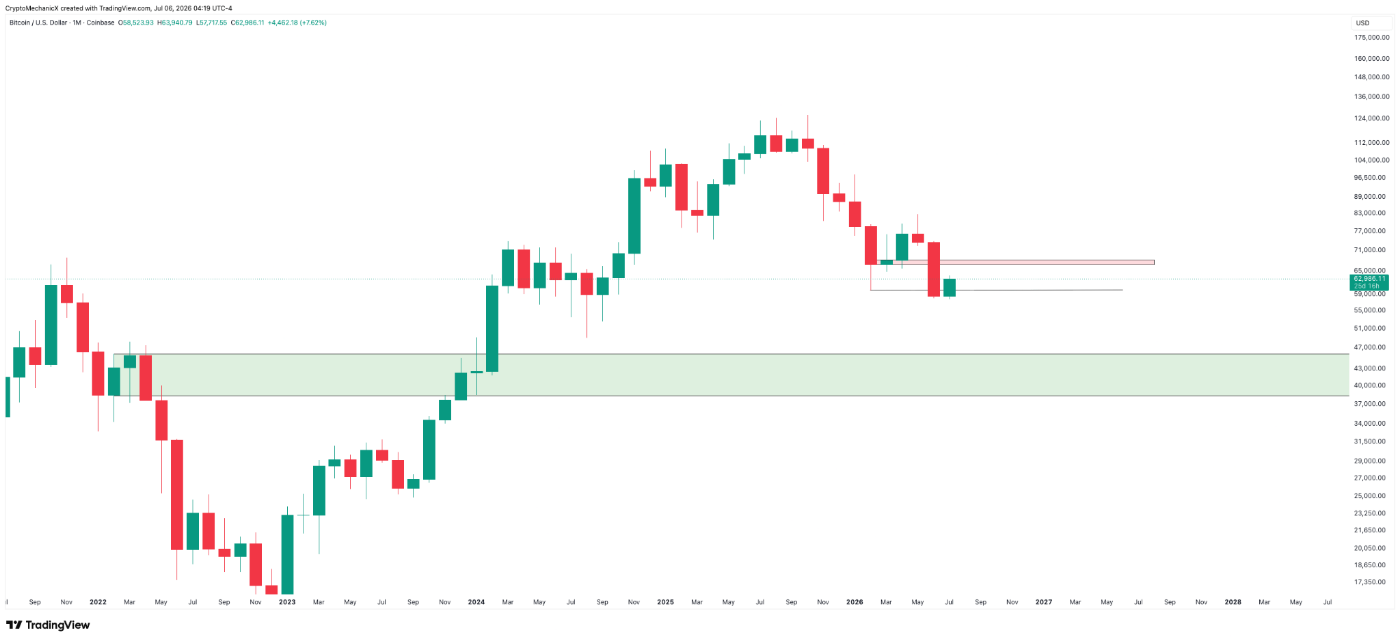
Keeping it straightforward, the monthly chart remains in a downtrend. Bounces will not change anything until we see a structural shift. A shift on the monthly chart takes time and could take months to develop, so there is not much to discuss here for now.
03BTCUSD Weekly
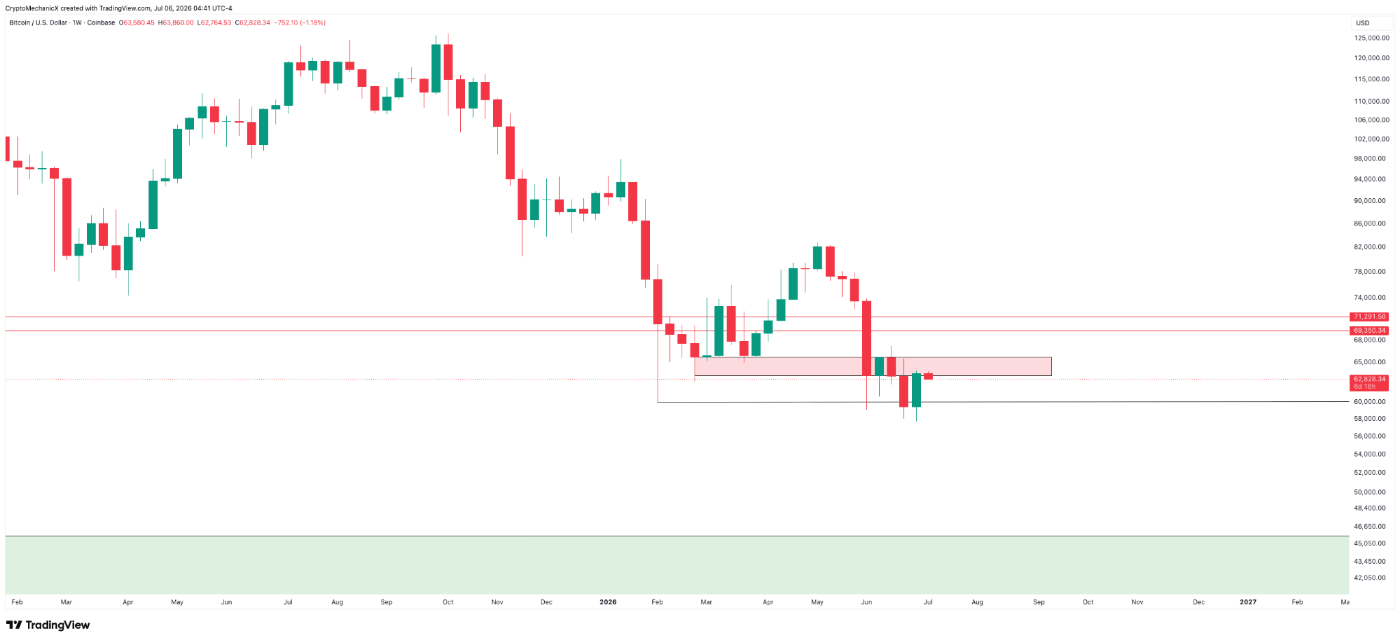
The weekly chart is pretty similar to the monthly chart. Bitcoin reclaimed the $60k level and swept the $59k low, which is generally a good sign. However, the overall market structure remains bearish.
Price is bouncing from a strong support zone, but it is hard to say how far this bounce can go because the weekly chart has a cluster of resistance levels overhead. The first resistance is right above the current price in the $64.5k to $66k zone. This is where Bitcoin was rejected last time. The next major resistance sits around the $70k to $72k zone.
04Last Week's Update
At the time, Bitcoin was trading around the $60k level, and we said that even though the higher time frames were bearish, you should not blindly short the market. Bears were struggling to push the price below the $59k to $60k zone, and that was not something to ignore.
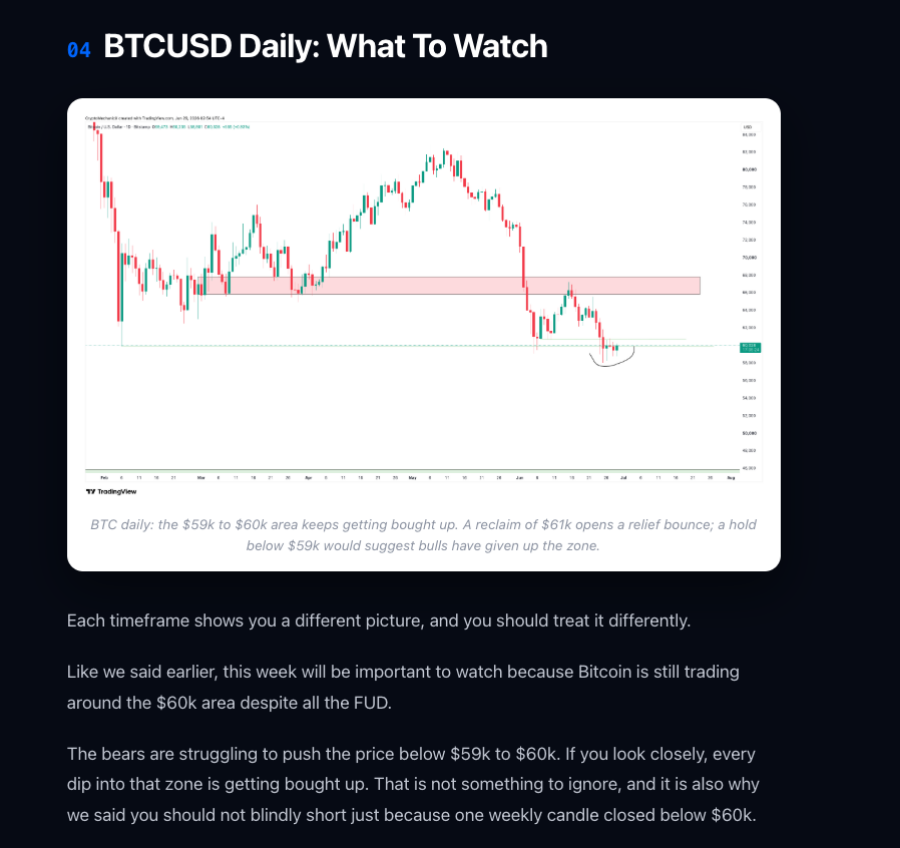
We discussed the same thing in multiple updates, and the strength on the lower time frames was the reason we entered a Bitcoin trade below $60k with a short-term target.
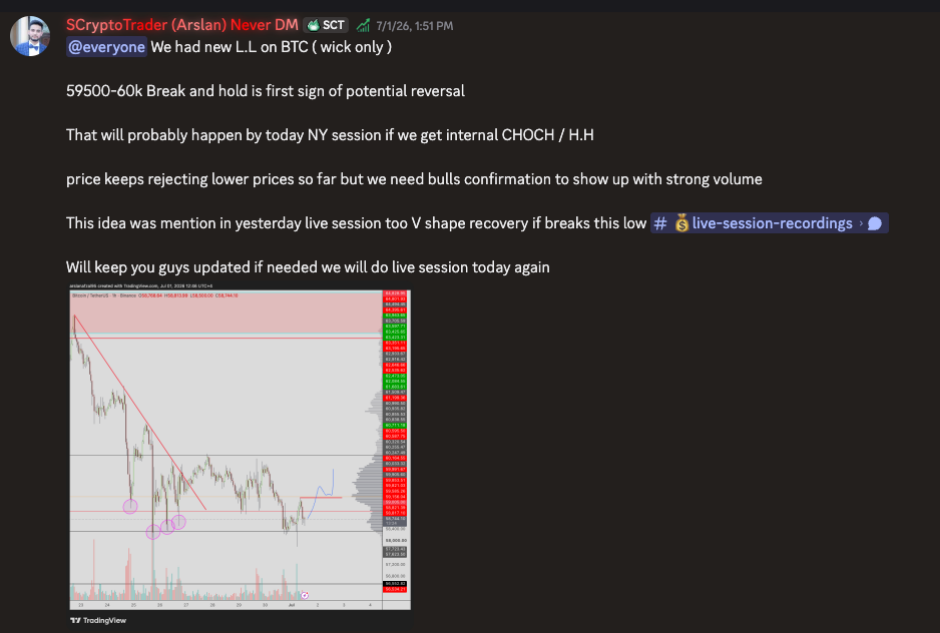
This is the high timeframe update. For timely day-to-day market updates, join our Discord server.
05Strategy Sold BTC
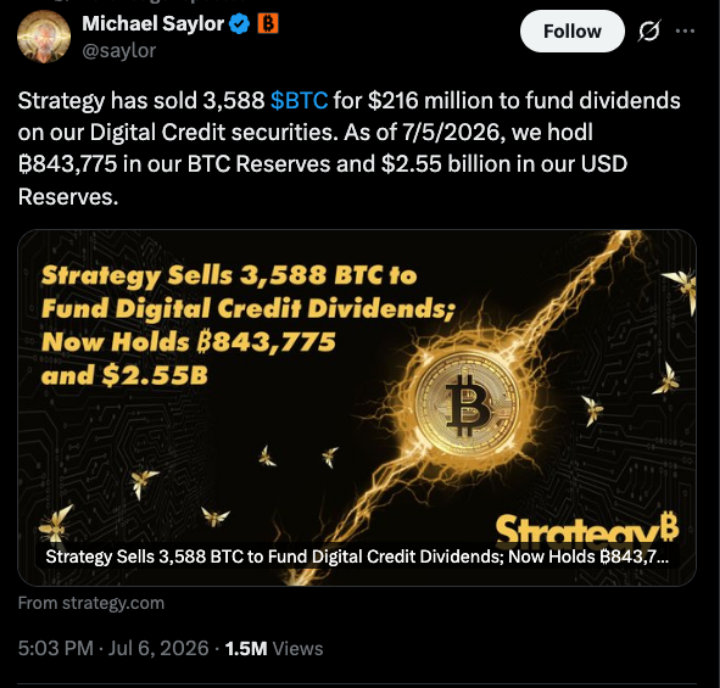
On Monday, Michael Saylor announced that Strategy had sold 3,588 BTC for $216 million to help fund its dividend payments. This did not come as a surprise. It was somewhat expected, and we even discussed in one of our previous articles that Strategy might eventually have to sell some Bitcoin.
Surprisingly, Bitcoin did not react the same way it did the last time Saylor sold just 32 BTC.
06Bitcoin ETFs Bought BTC
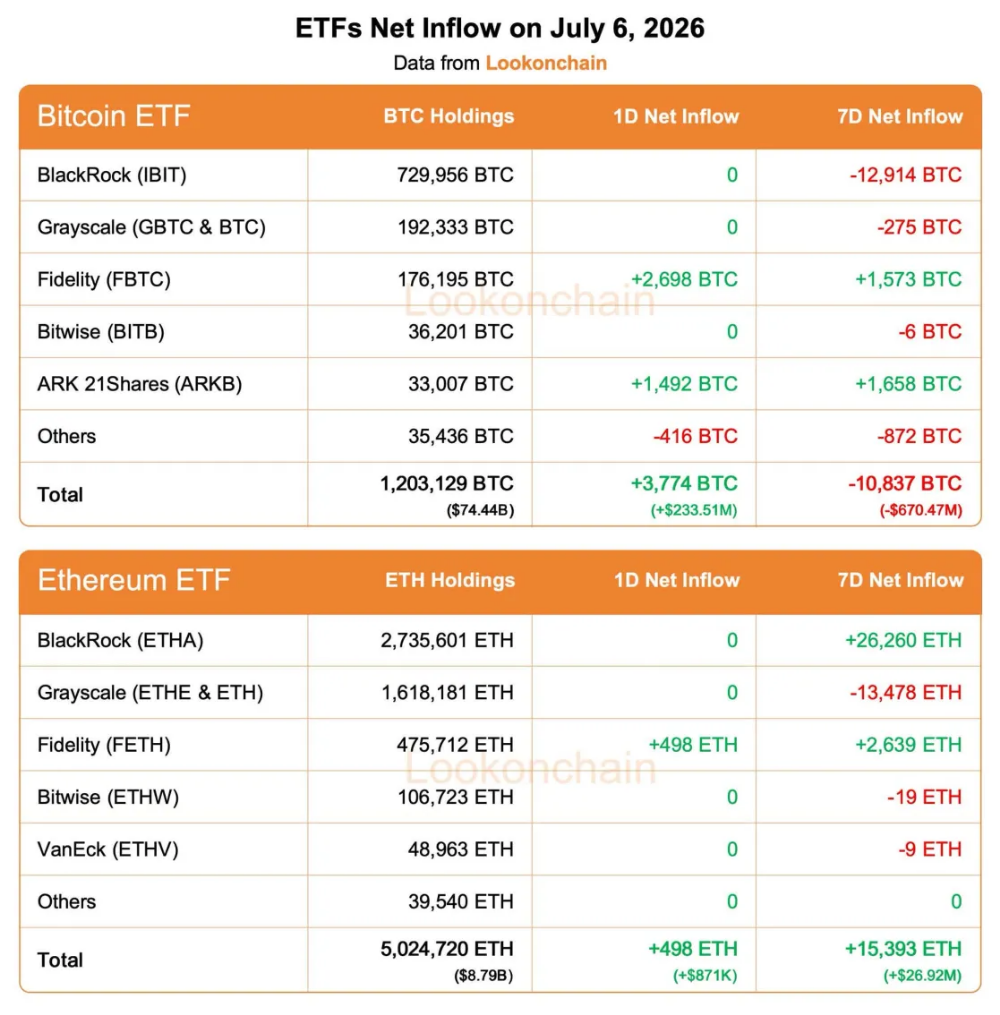
Over the past few weeks, ETFs had been continuously selling Bitcoin, and we kept you updated on it. We mentioned that one of the main reasons behind the selling pressure on Bitcoin was the persistent ETF outflows.
In fact, U.S. spot Bitcoin ETFs recorded a historic $4.5 billion in net outflows during June, making it their worst month of redemptions since they launched in January 2024. Then U.S. spot Bitcoin ETFs recorded a $223.5 million net inflow on July 2, the first since June 12.
07Key Things To Watch This Week
- Can Bitcoin continue to defend the $60k support?
- The market showed little reaction to Strategy's Bitcoin sale.
- Will ETF inflows return after June's record outflows?
That is pretty much it for this Bitcoin update. It should be an interesting week ahead. Let's see how the market responds.
Risk Disclaimer: This article is for education and market analysis only. It is not financial advice. Bitcoin is highly volatile and every trader or investor should do their own research and manage risk properly.
Educational content only. Not financial advice. Trading involves risk.