Bitcoin Closed Below $60K: What Comes Next?

Bitcoin just closed a weekly candle below $60k for the first time since the February low. With ETF outflows picking up and plenty of FUD around, here is a simple look at what it means for market structure and what to watch next.
- ✓Bitcoin closed the week below $60k, confirming a new lower low on the weekly chart.
- ✓ETF demand has weakened: around $1.79 billion left Bitcoin ETFs last week alone.
- ✓As long as the weekly structure stays bearish, lower highs and lower lows can continue.
- ✓Price is still defending the $59k to $60k area, so this week is important to watch.
Educational content only. Not financial advice. This article is general market commentary to help you understand Bitcoin's market structure. It is not a recommendation to buy, sell or hold any asset.
01Why Bitcoin Is Showing Weakness
Bitcoin continues to show weakness, with the two major factors being ETF outflows and the situation surrounding Saylor's STRC and MSTR.
ETF demand has weakened over the past few weeks. Last week alone, $1.79 billion was withdrawn from Bitcoin ETFs.
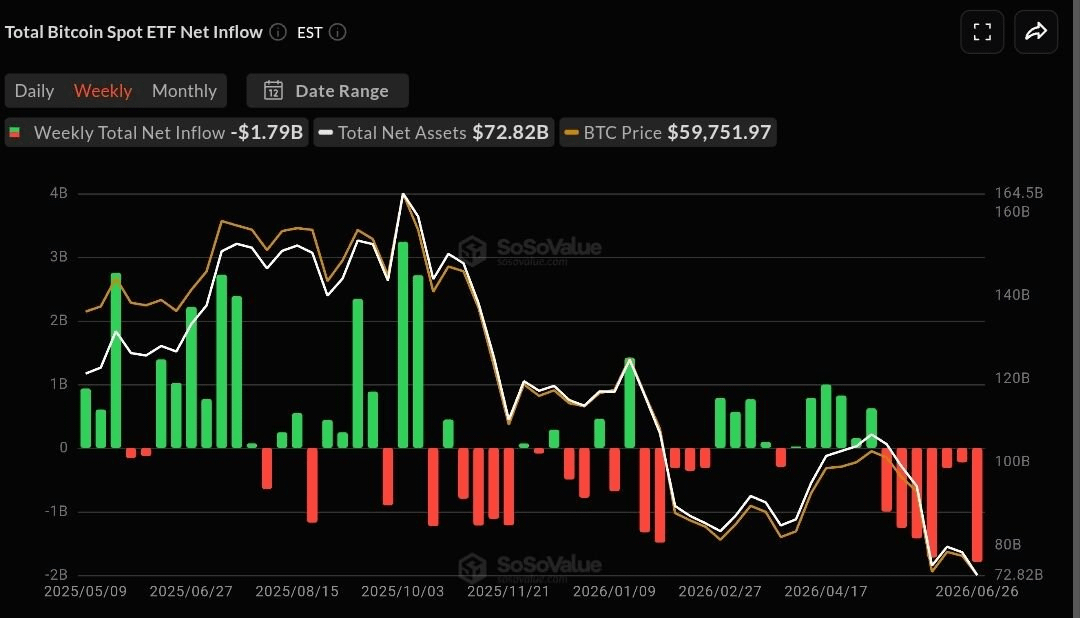
This week is important to watch for two reasons:
- Bitcoin is trading around the key $60k zone despite all the FUD.
- Bitcoin's weekly candle closed under the February low ($60k).
Let's go straight to the charts to see what is happening and what we can expect from Bitcoin this week.
02The Weekly Downtrend Continues
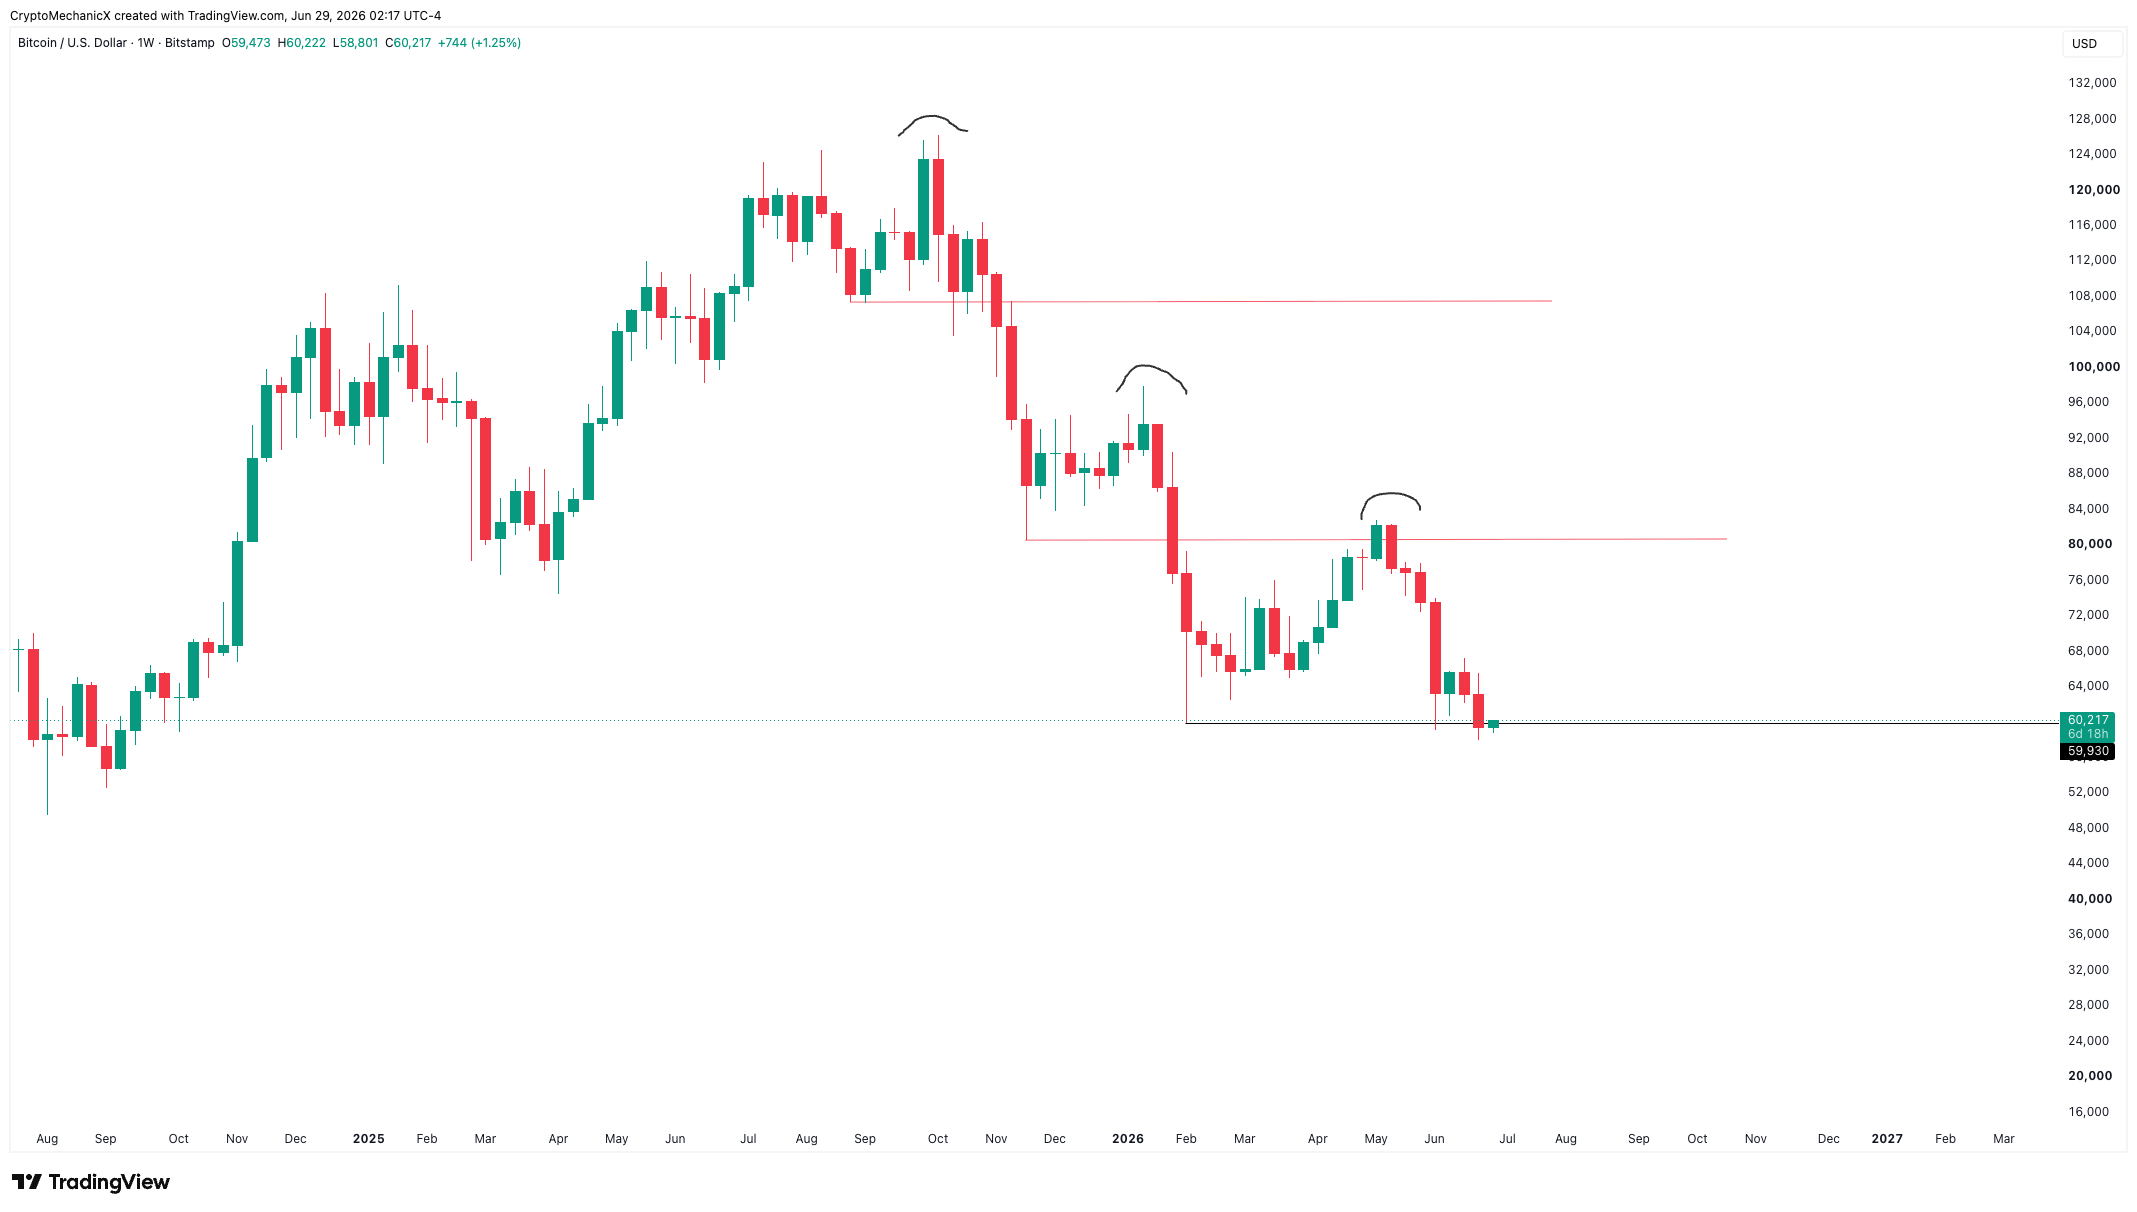
Bitcoin closed below $60k this week, confirming a new lower low on the weekly chart. That also makes $82k the latest lower high on the weekly.
Keeping it simple: as long as the weekly market structure does not change, Bitcoin can continue printing lower highs and lower lows.
There will obviously be plenty of rallies and bounces along the way, but they do not change the overall weekly trend unless the market structure shifts.
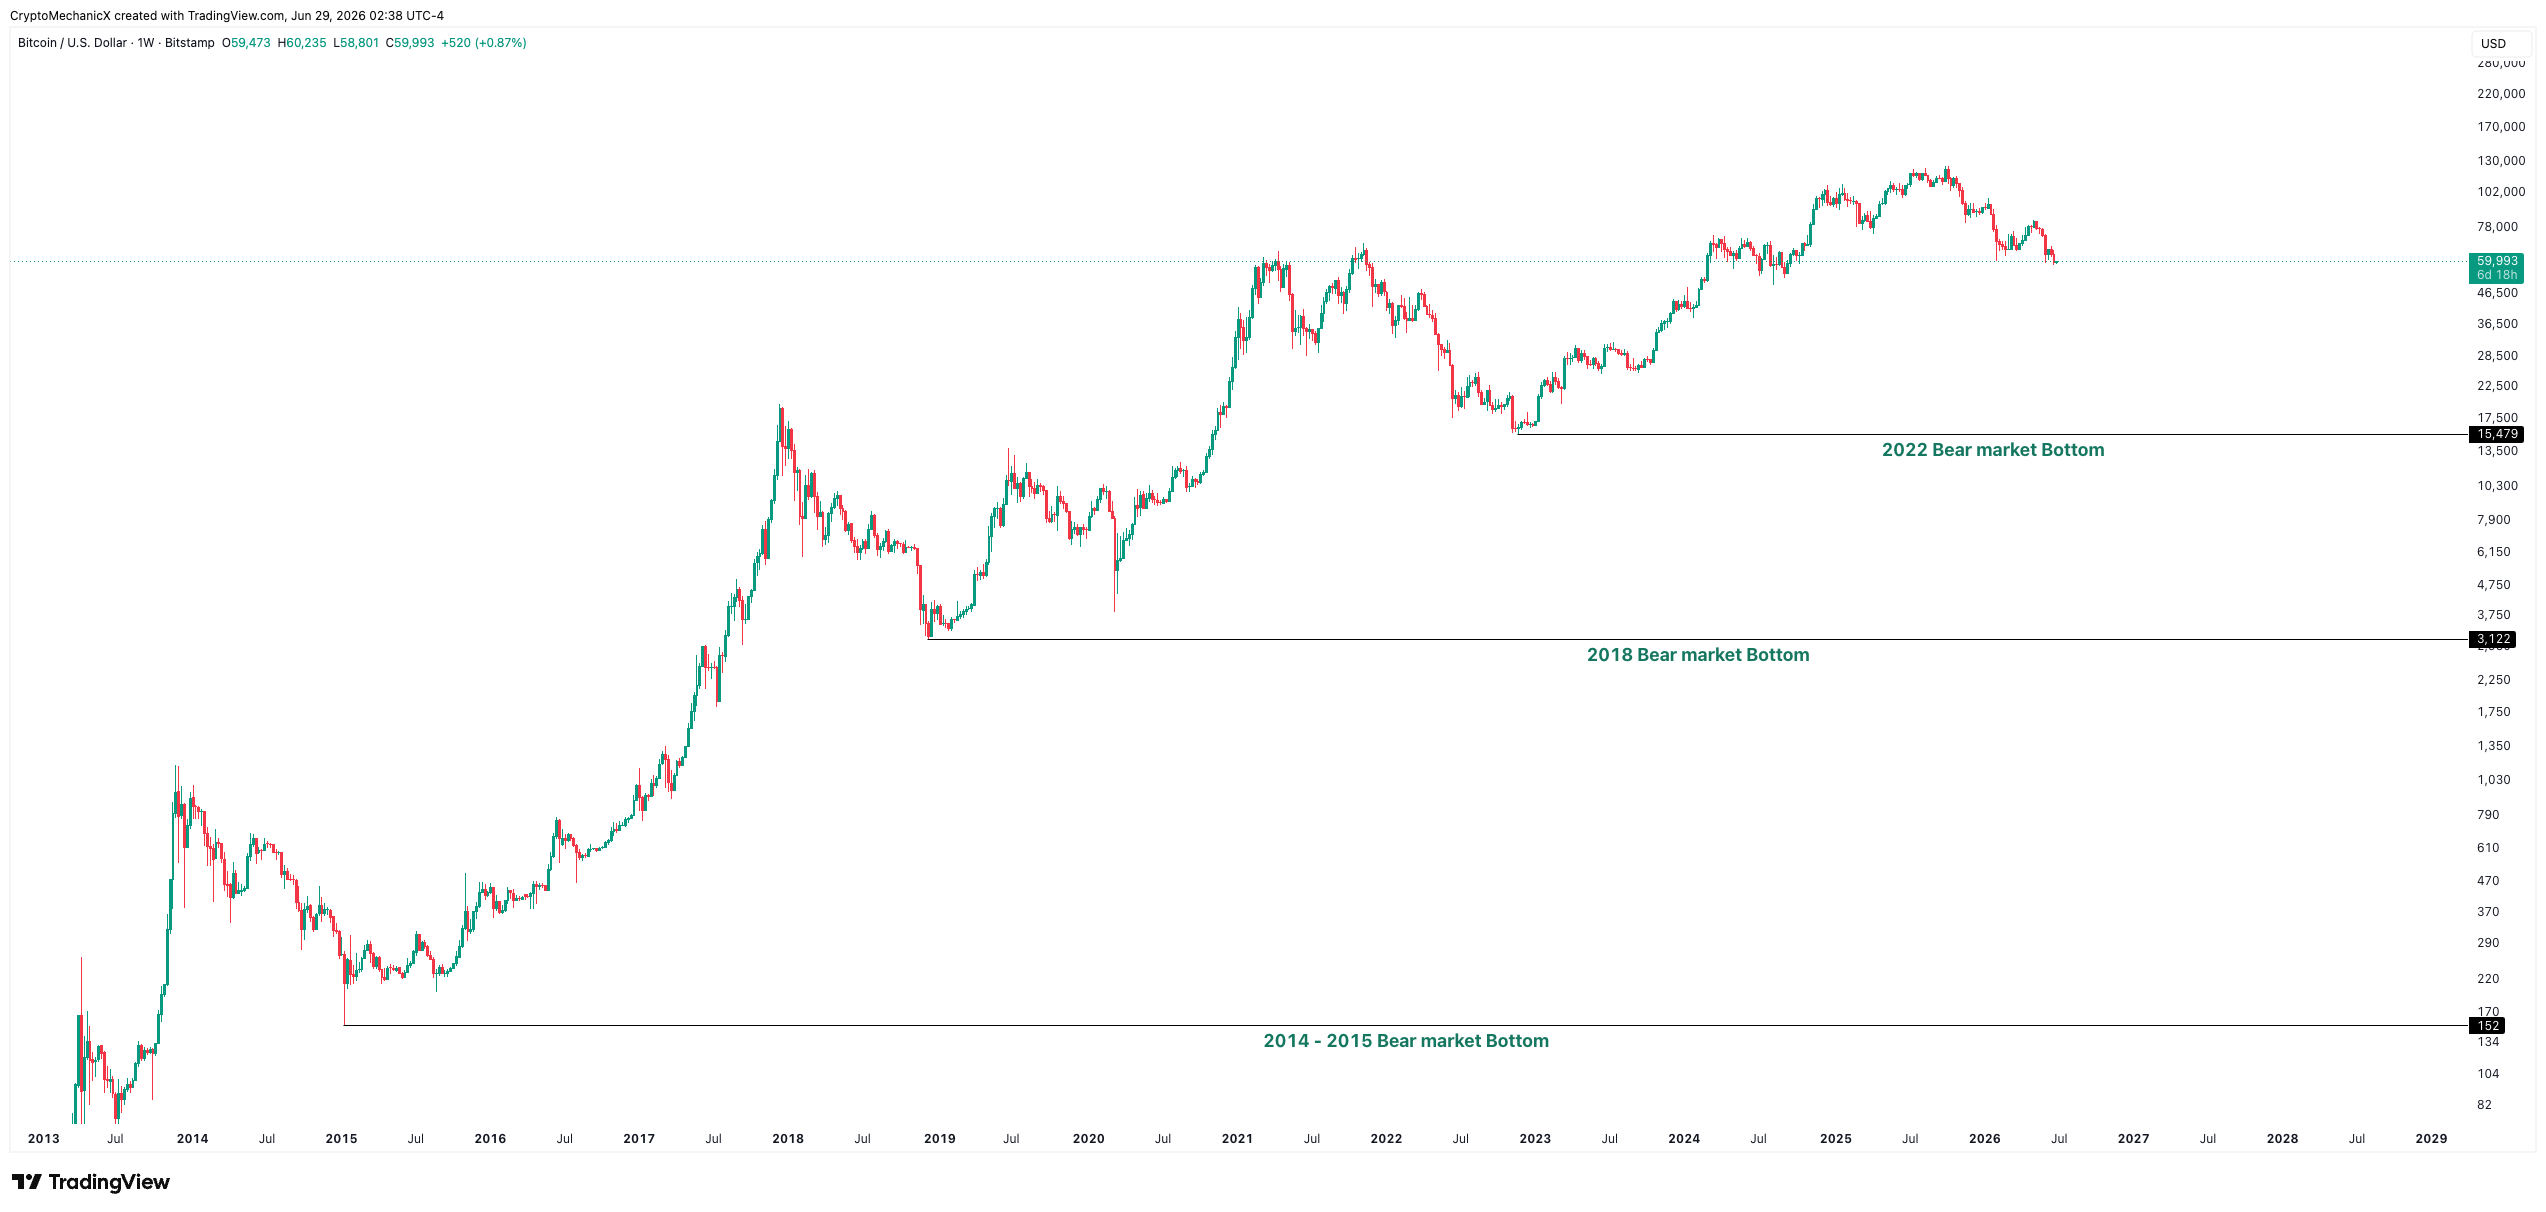
One thing to keep in mind about Bitcoin: if the market is truly shifting its structure, it should not come back to test the key lows, let alone close below them.
Historically, once Bitcoin has put in a major bottom, it has not gone back to retest it.
This weekly close below $60k suggests there could still be more downside ahead.
03Where Bitcoin Could Go
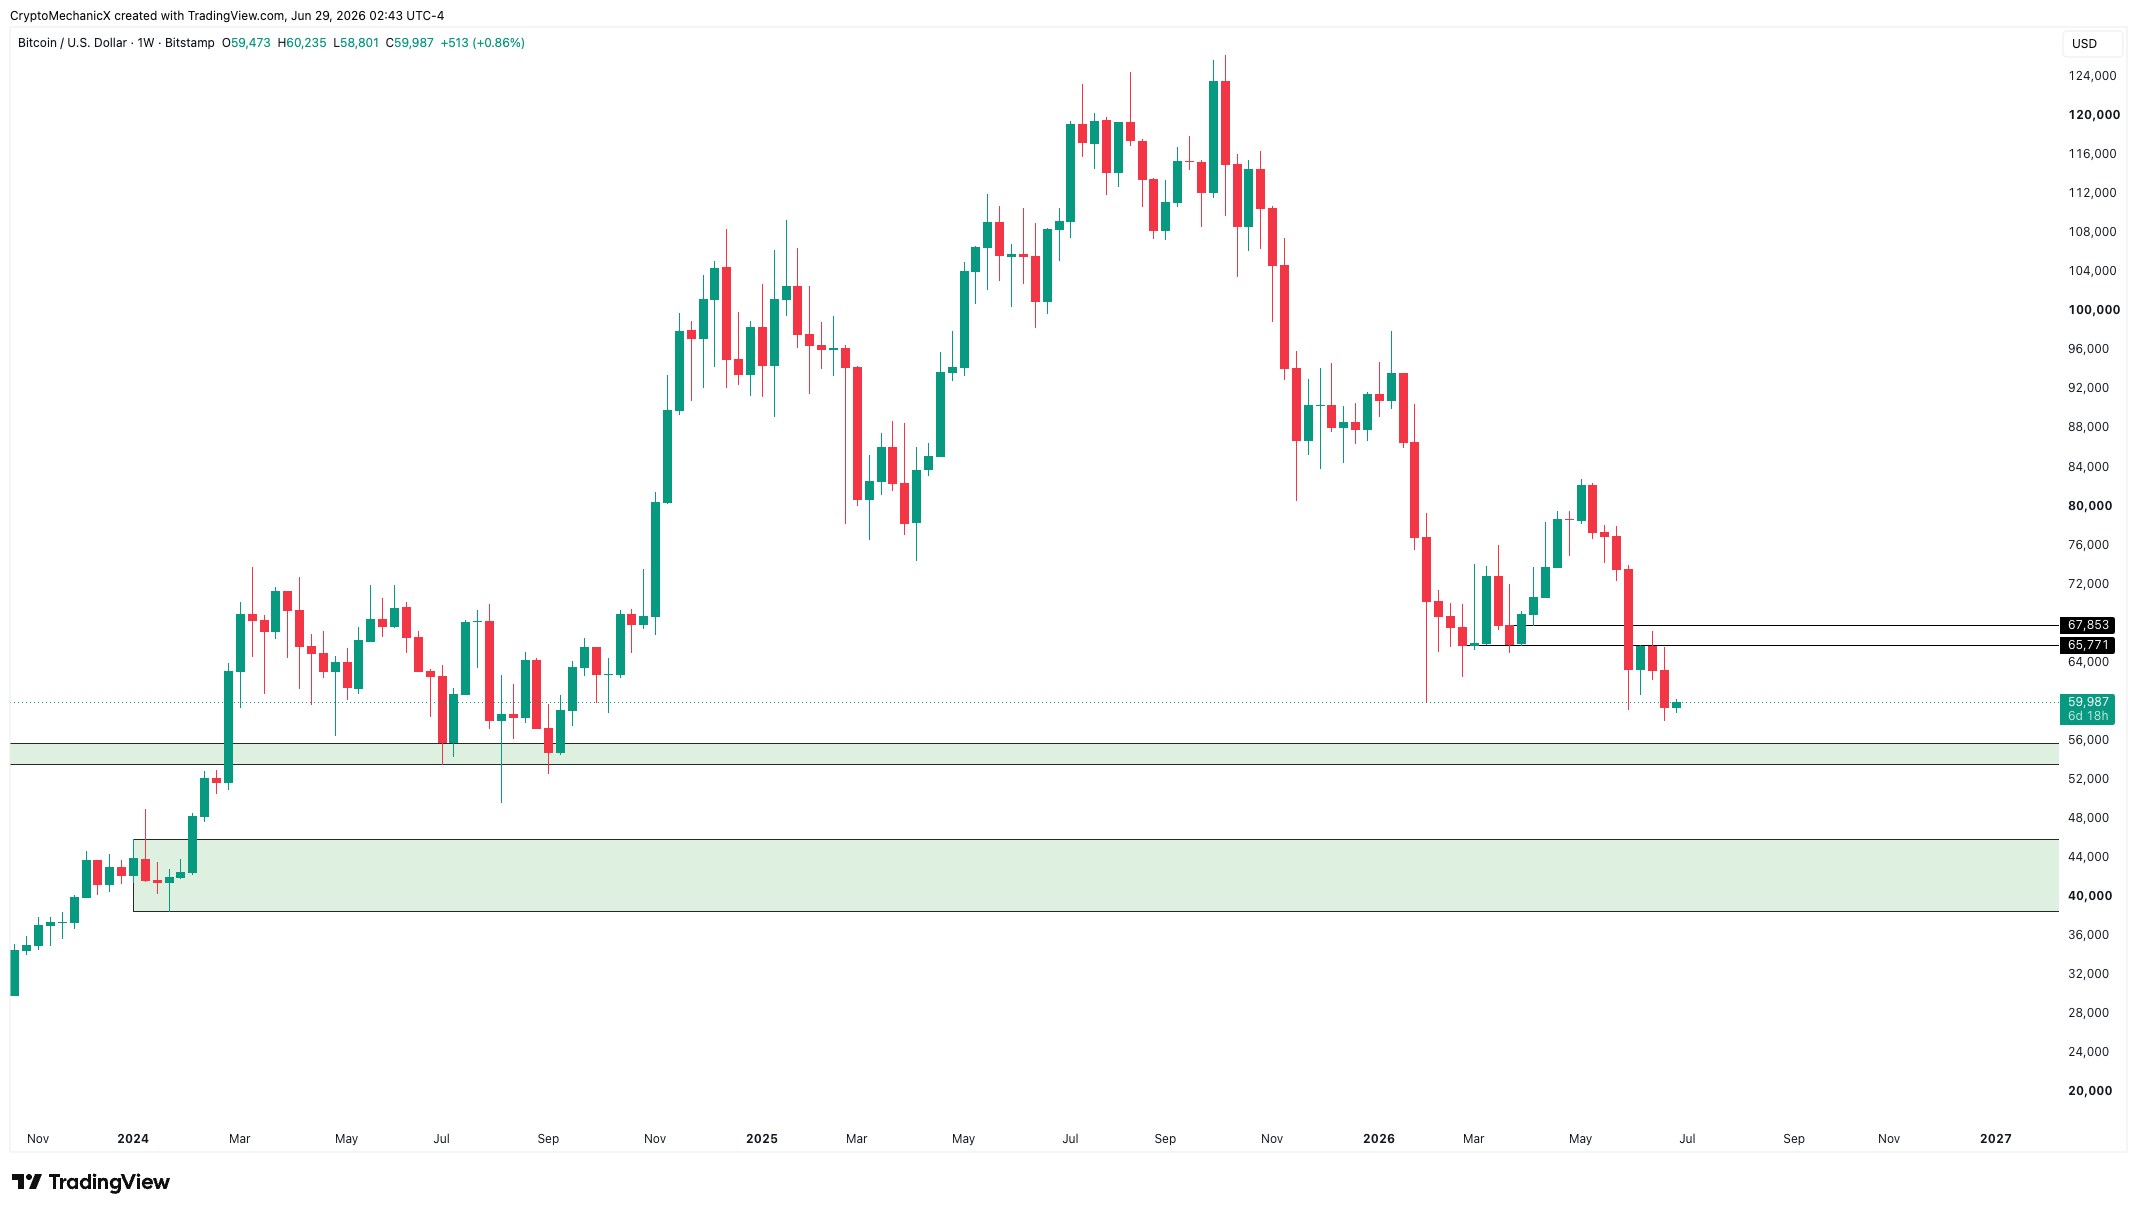
We know everyone is sharing different downside targets, and we have always said this: as long as the market structure is bearish, you can make a case for lower targets because the trend gives you a reason to.
As long as the weekly structure remains bearish, the next major zone is $52k to $55k. Worst case scenario? Around $38k to $45k.
Should you short based on the weekly chart?
We don't think so. Like we said above, there will likely be multiple bounces along the way, and that is where leverage can get you caught.
Shorting at $60k based on a single weekly close is not a good idea, in our opinion. The market can always fake people out, and most of you already know that.
We are not into shorting, but if you are, we would rather look to short into key resistance than at key support.
04BTCUSD Daily: What To Watch
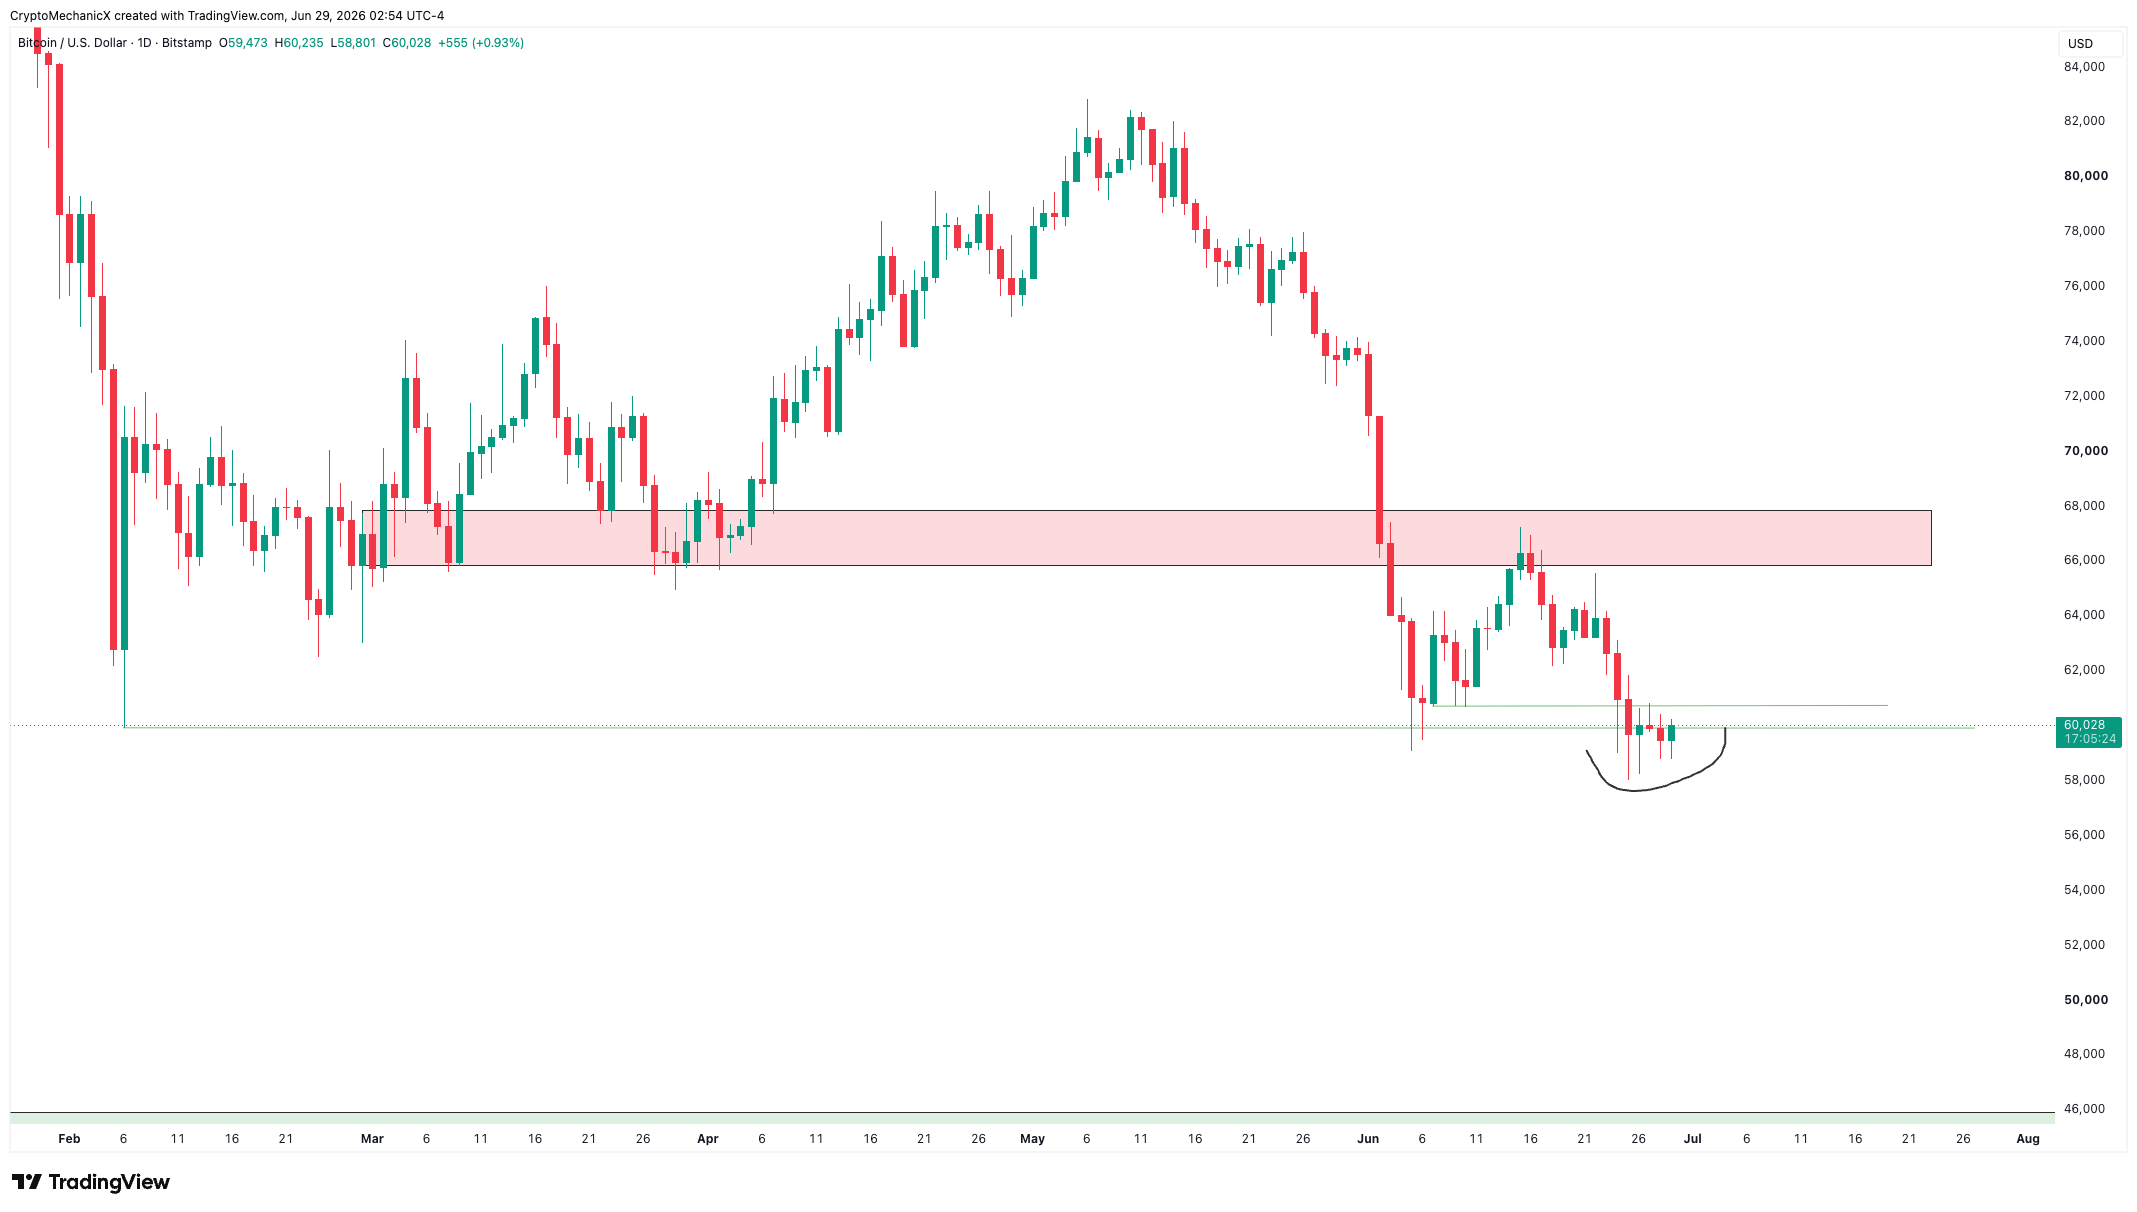
Each timeframe shows you a different picture, and you should treat it differently.
Like we said earlier, this week will be important to watch because Bitcoin is still trading around the $60k area despite all the FUD.
The bears are struggling to push the price below $59k to $60k. If you look closely, every dip into that zone is getting bought up. That is not something to ignore, and it is also why we said you should not blindly short just because one weekly candle closed below $60k.
If Bitcoin reclaims $61k and manages to hold above it, you can expect a relief bounce. And holding below $59k would mean bulls have finally given up on this zone.
It is only the first day of the week, so there is no need to rush into a long or a short.
The daily chart and lower timeframes will be the key ones to watch. Observe first, then execute based on whether the market shows strength or weakness.
That is pretty much it for this Bitcoin update. Let us know what you think, your opinions are always welcome.
Risk Disclaimer: This article is for education and market analysis only. It is not financial advice. Bitcoin is highly volatile and every trader or investor should do their own research and manage risk properly.
Educational content only. Not financial advice. Trading involves risk.