Bitcoin Buy Opportunity: Is The 4-Year Cycle Pointing To The Next BTC Bottom?

Bitcoin has followed a powerful 4-year cycle for over a decade. After every major top, the market corrects hard. But history shows it also creates the next long term accumulation opportunity. Here is an educational look at where we stand now.
- ✓Bitcoin has historically moved in clear 4-year market cycles.
- ✓Major corrections often happen before the next strong bull phase begins.
- ✓Previous cycle bottoms aligned near the 0.618 to 0.786 Fibonacci retracement zone.
- ✓The current market is approaching an important decision area. Confirmation is still needed.
Educational content only. Not financial advice. This article is general market commentary to help you understand Bitcoin's historical cycle patterns. It is not a recommendation to buy, sell or hold any asset.
01What The Current BTC Chart Is Telling Us
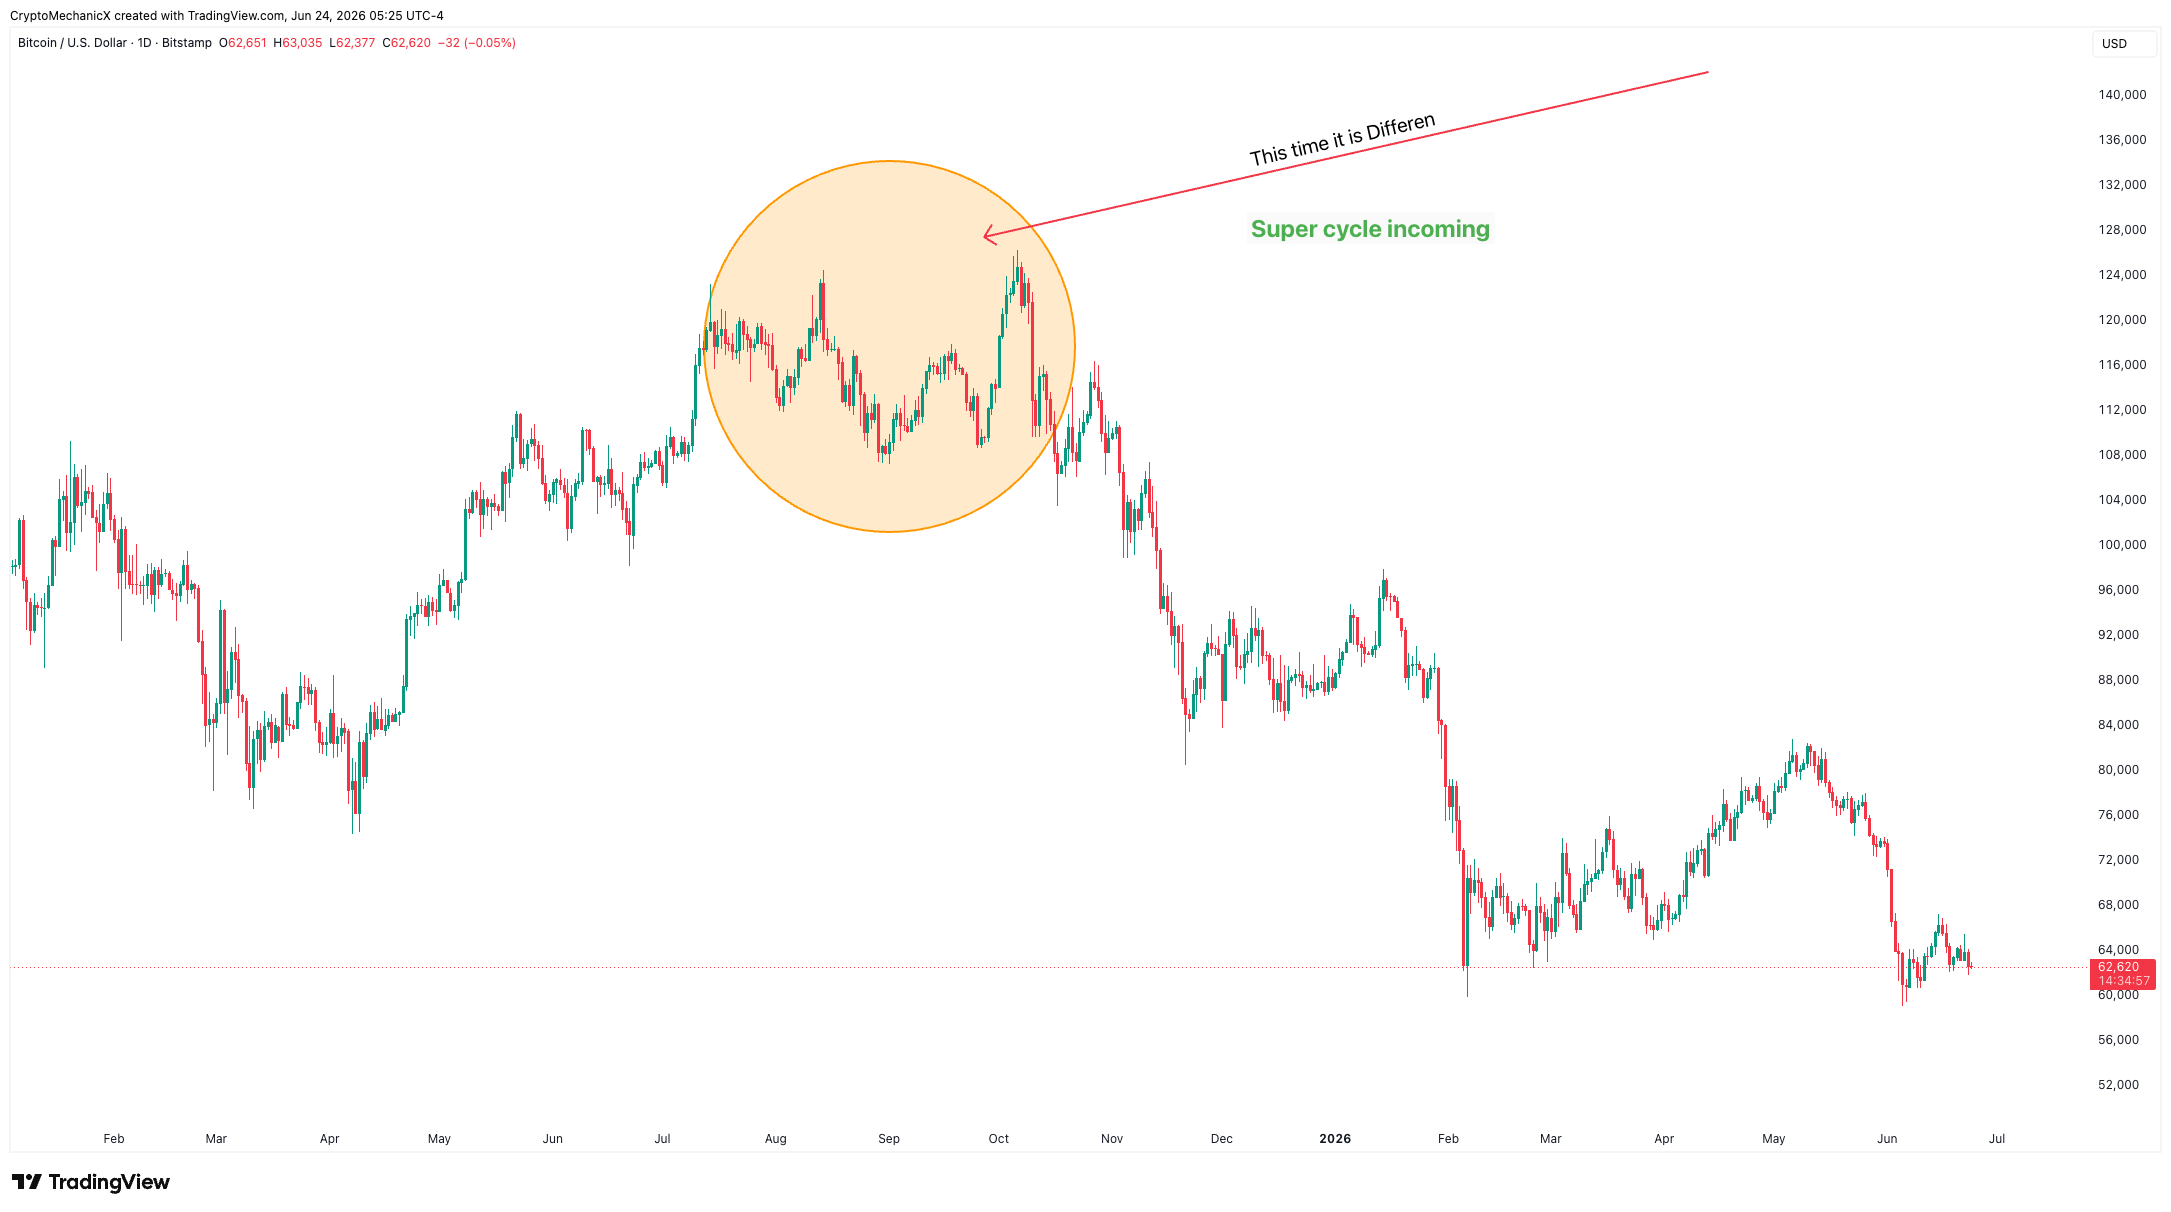
Bitcoin reached a cycle peak around October 2025. Since then, price has been grinding lower. Many people who were calling for a "super cycle" or "this time it is different" are now watching those expectations fade as the structure plays out in a familiar way.
The daily chart shows BTC dropped from a high near $126K and has been forming lower structure ever since. The market is now trading in the low $60K area, well below where most of the hype was concentrated.
02Bitcoin's 4-Year Cycle: A Pattern That Keeps Repeating
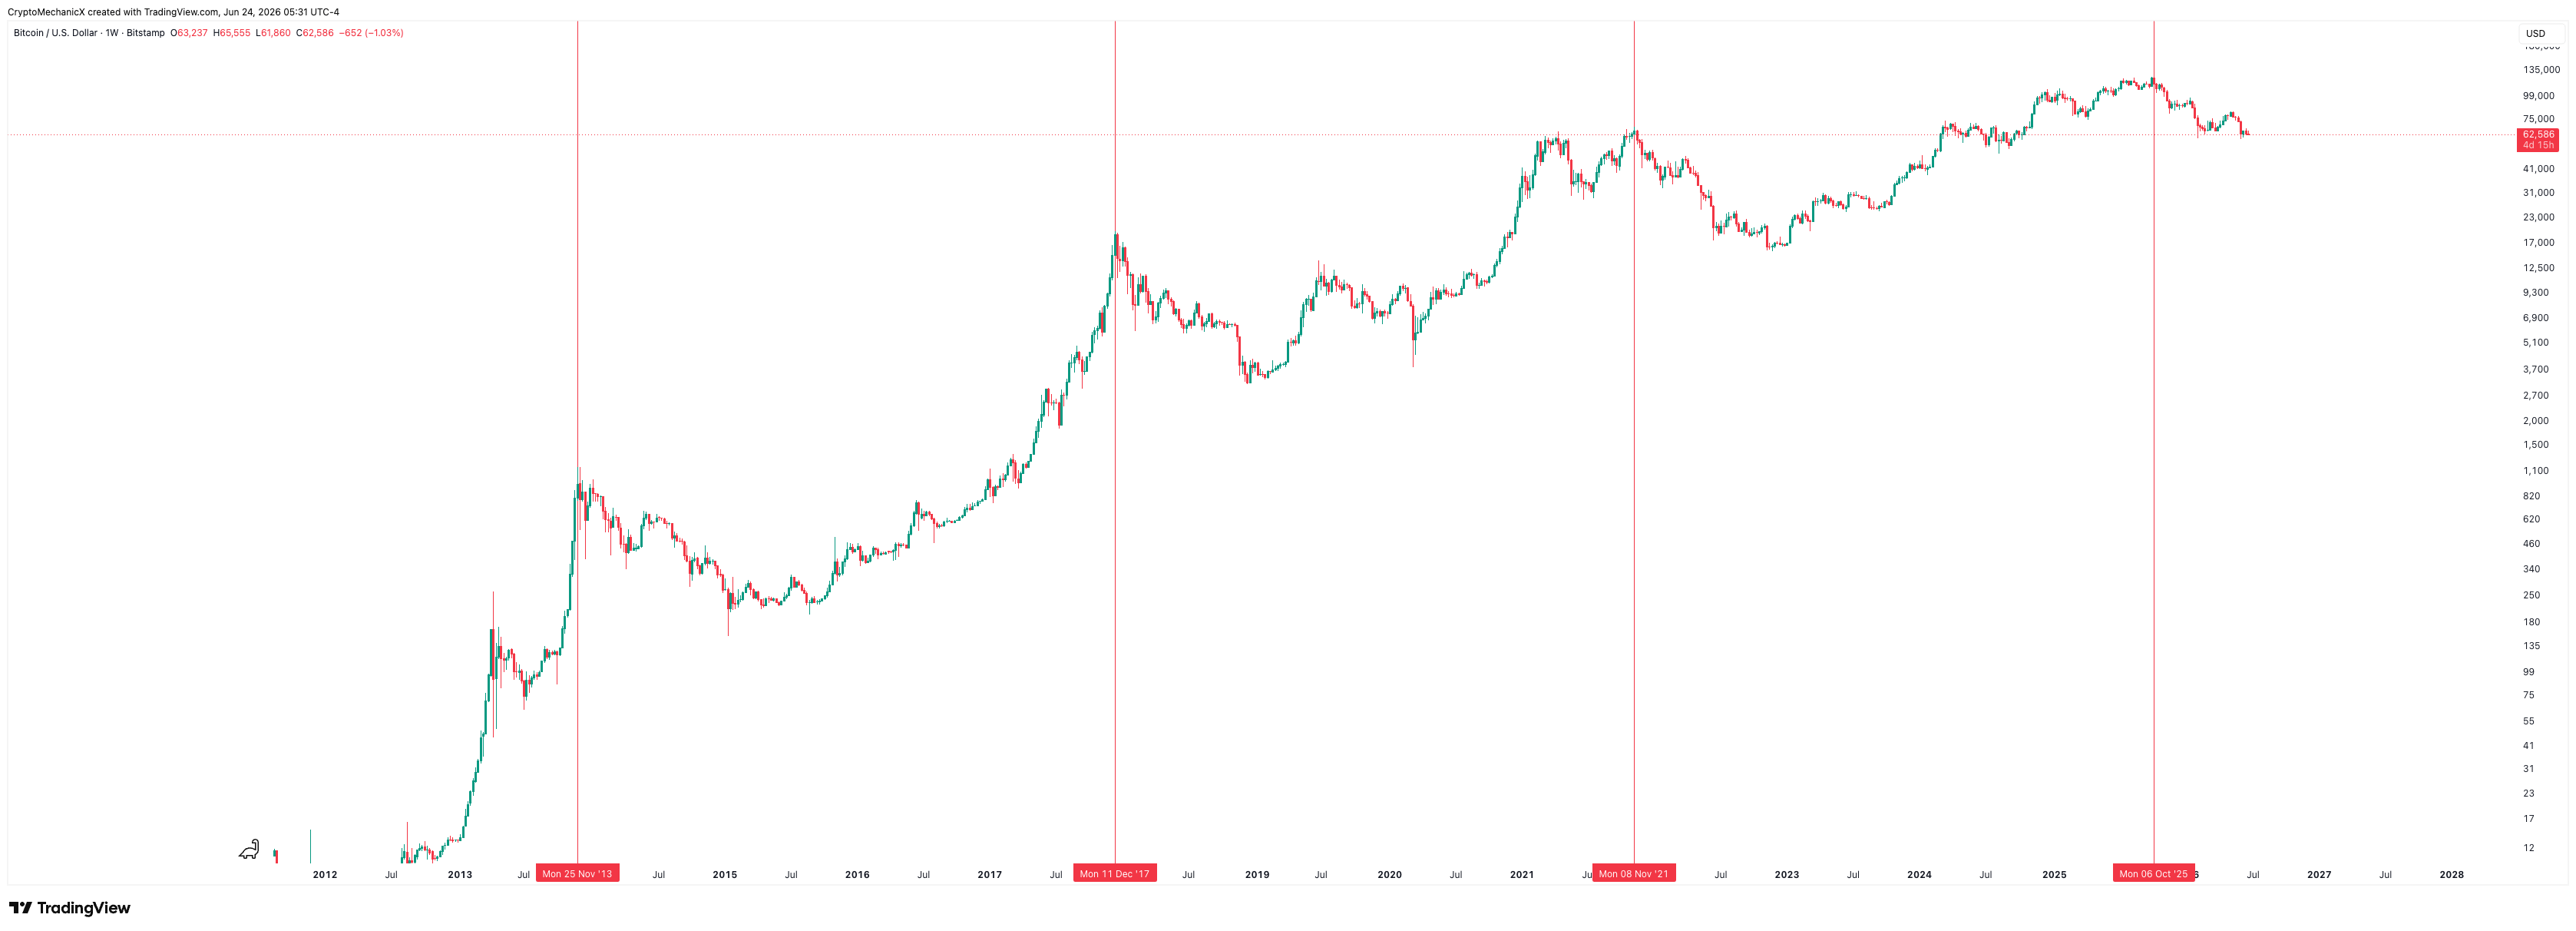
If you zoom out to the weekly chart and look at Bitcoin's full history, one thing stands out immediately: the market has topped and bottomed roughly every 4 years.
- Bitcoin topped in November 2013
- Four years later, it topped again in December 2017
- Another four years later, Bitcoin peaked in November 2021
- Following the same rhythm, the most recent cycle top formed around October 2025
Four years. Every single time. The market does not care about opinions or headlines. It just keeps repeating the same structural pattern.
03The Bear Market: How Long Does It Last?
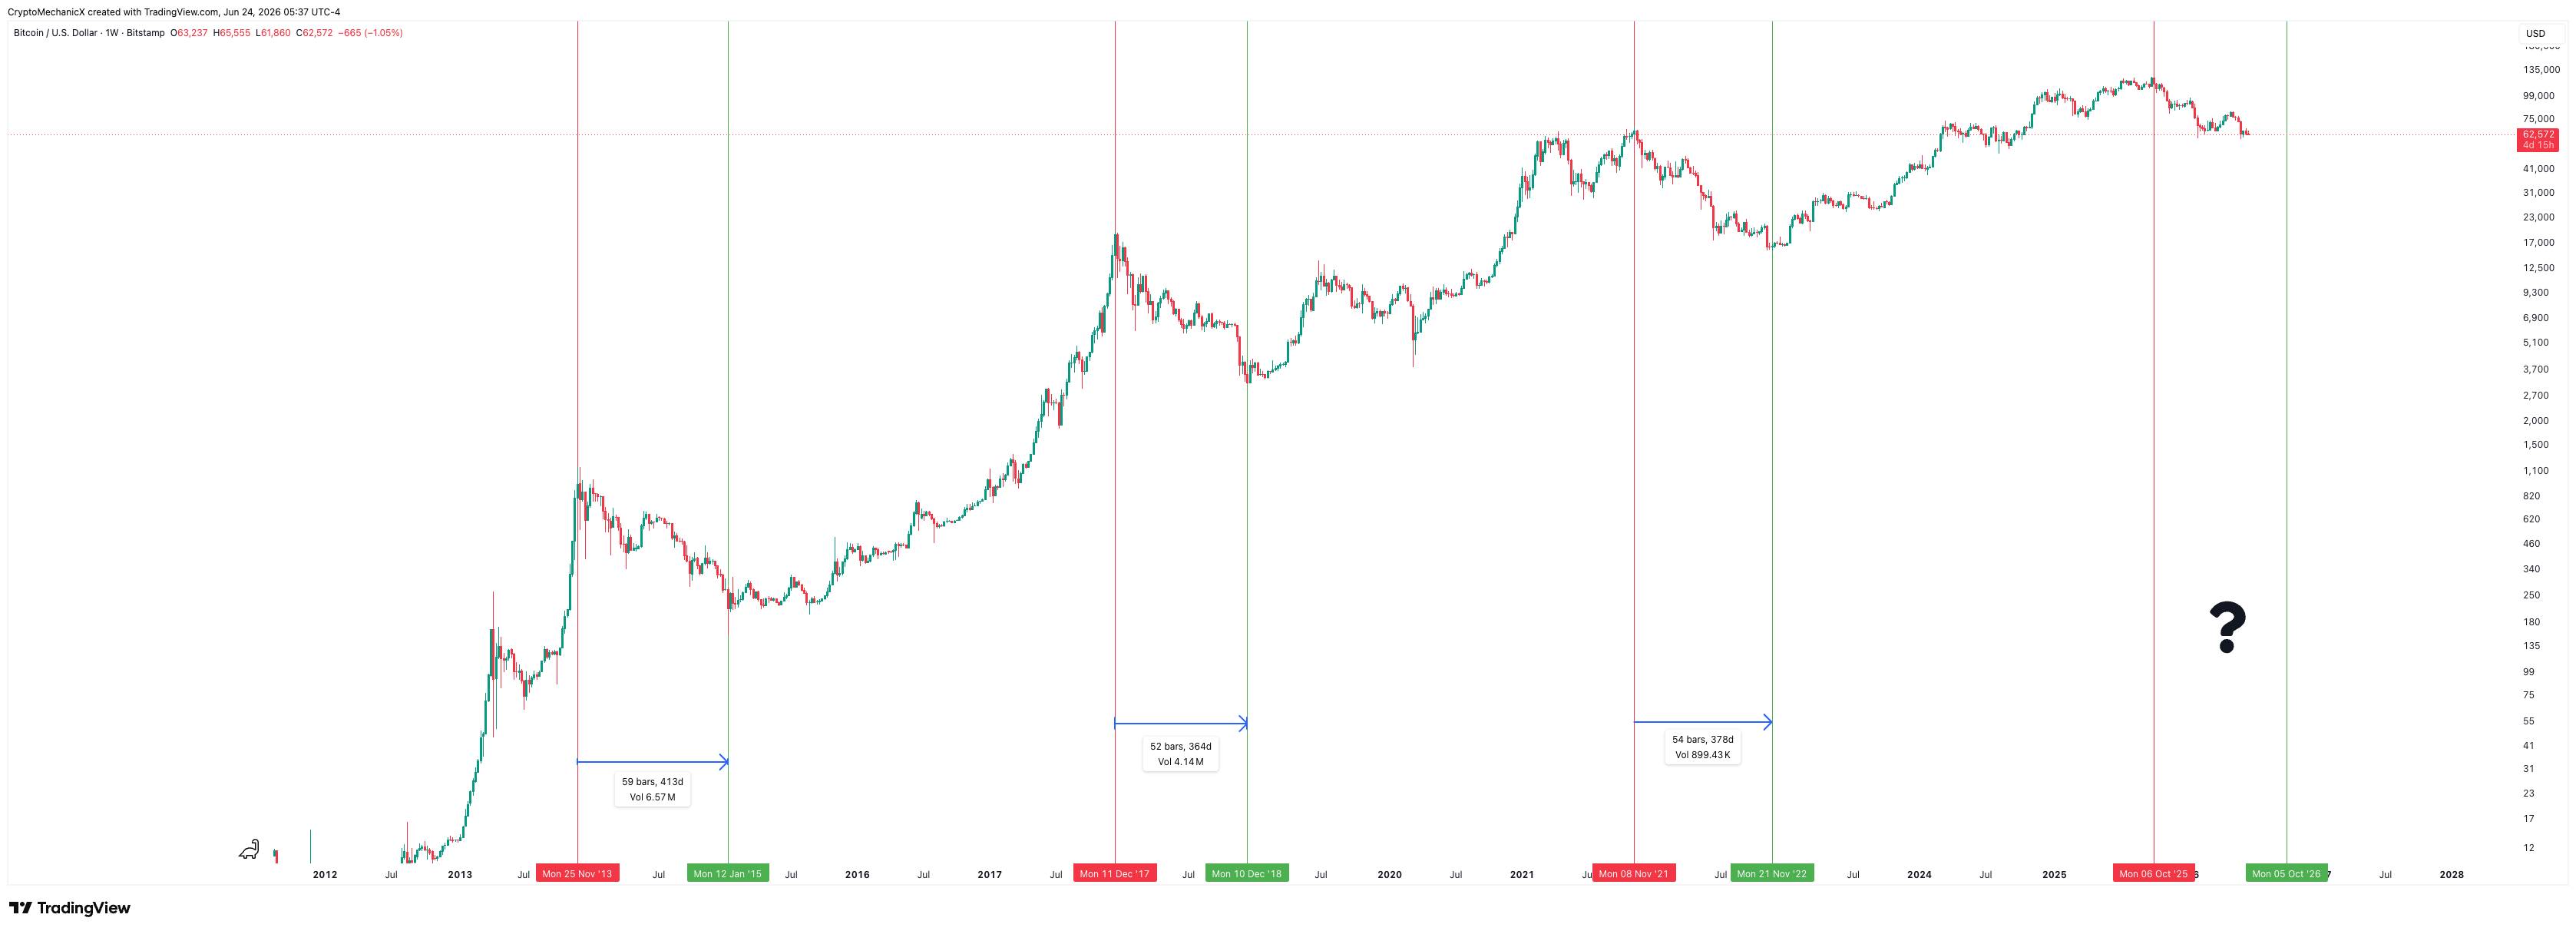
Historically, Bitcoin follows a familiar rhythm after every cycle top. Roughly 3 years of upside, followed by about 1 year of bear market, and then the next cycle begins.
Looking at the timing measurements from each cycle bottom to the next cycle top, the data is strikingly consistent:
- 2013 bottom → 2017 top: ~59 weekly bars (413 days)
- 2018 bottom → 2021 top: ~52 weekly bars (364 days)
- 2022 bottom → 2025 top: ~54 weekly bars (378 days)
Based purely on historical pattern, the next important accumulation window could begin sometime around late 2026. No pattern is guaranteed to repeat exactly. But knowing the historical rhythm helps you plan rather than react.
04Where Do Cycle Bottoms Happen? The Fibonacci Answer
Every bear market creates fear. Most people become scared to buy exactly when the best historical opportunities appear. One of the simplest ways to identify potential accumulation zones is Fibonacci retracement levels.
This is not about finding the exact bottom. It is about finding the area where Bitcoin has historically offered the best long term risk to reward. Looking at each past bear market tells a very consistent story.
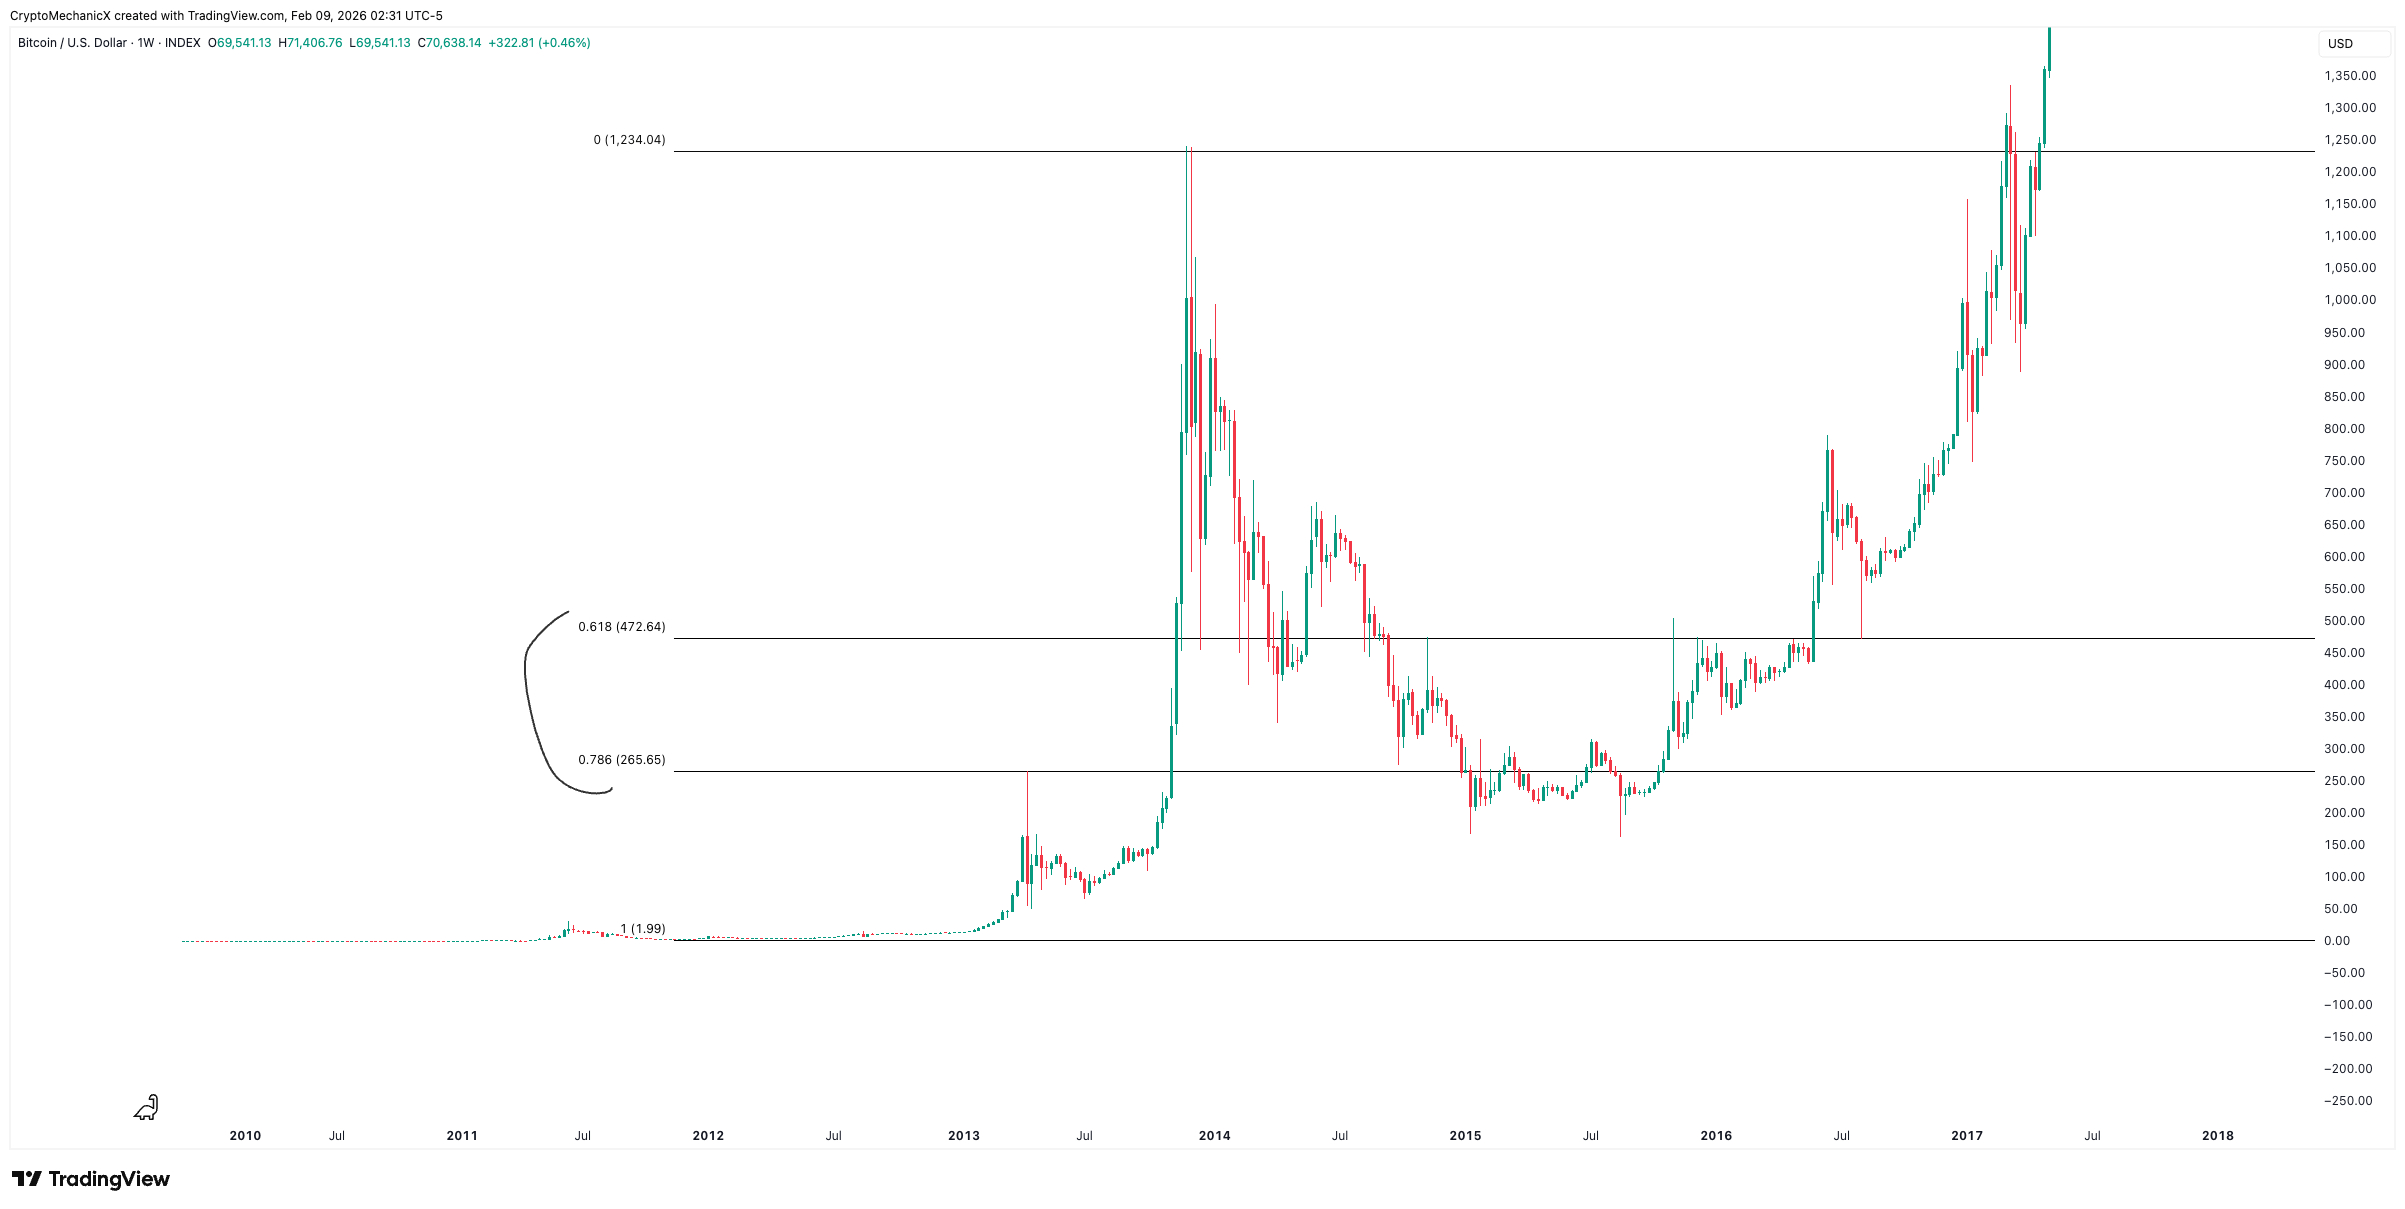
2014 Bear Market
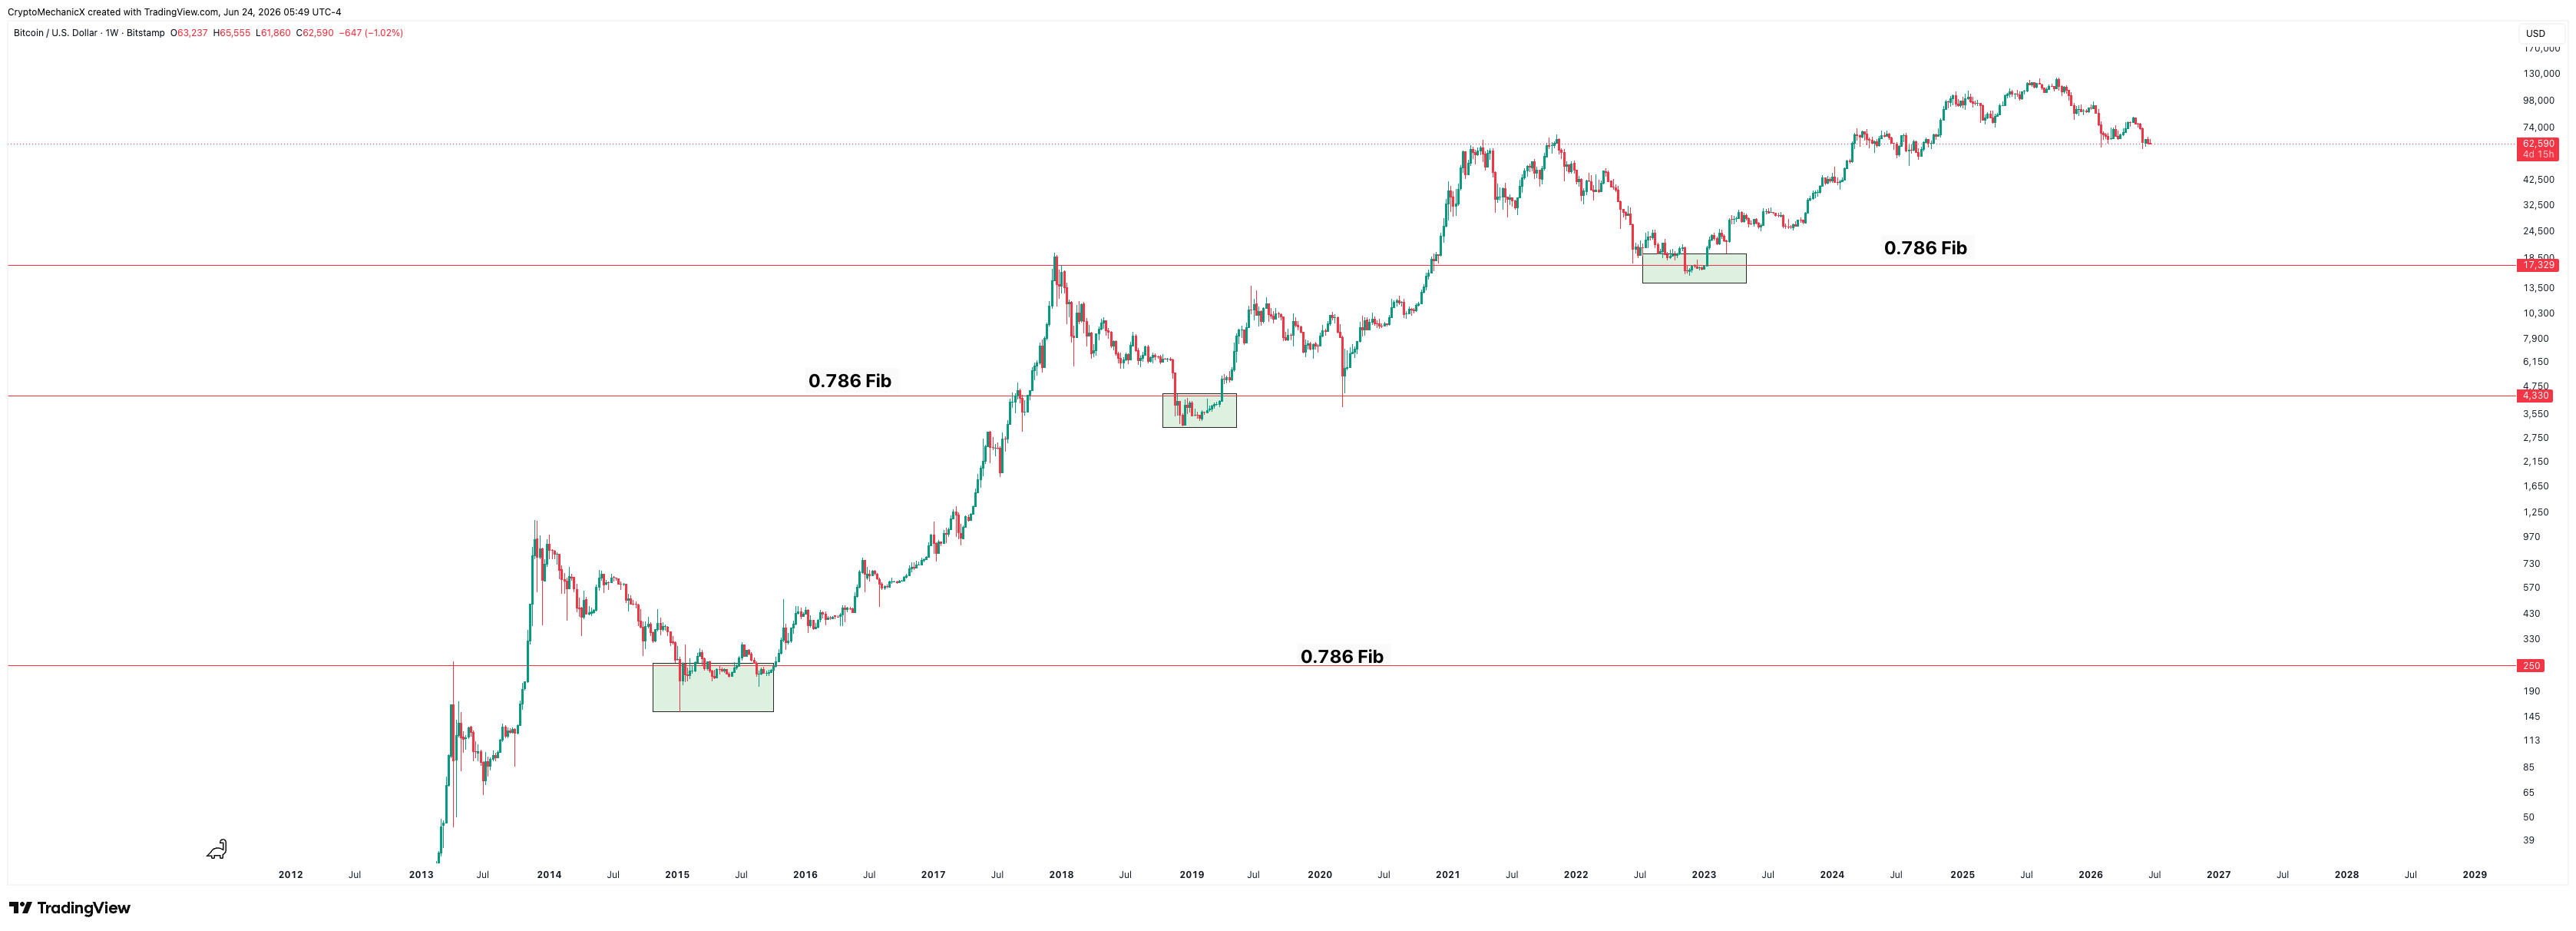
After peaking in 2013, Bitcoin retraced deep into the 0.786 Fibonacci level around $265. This area acted as the historical low before the next major bull run began.
2018 Bear Market
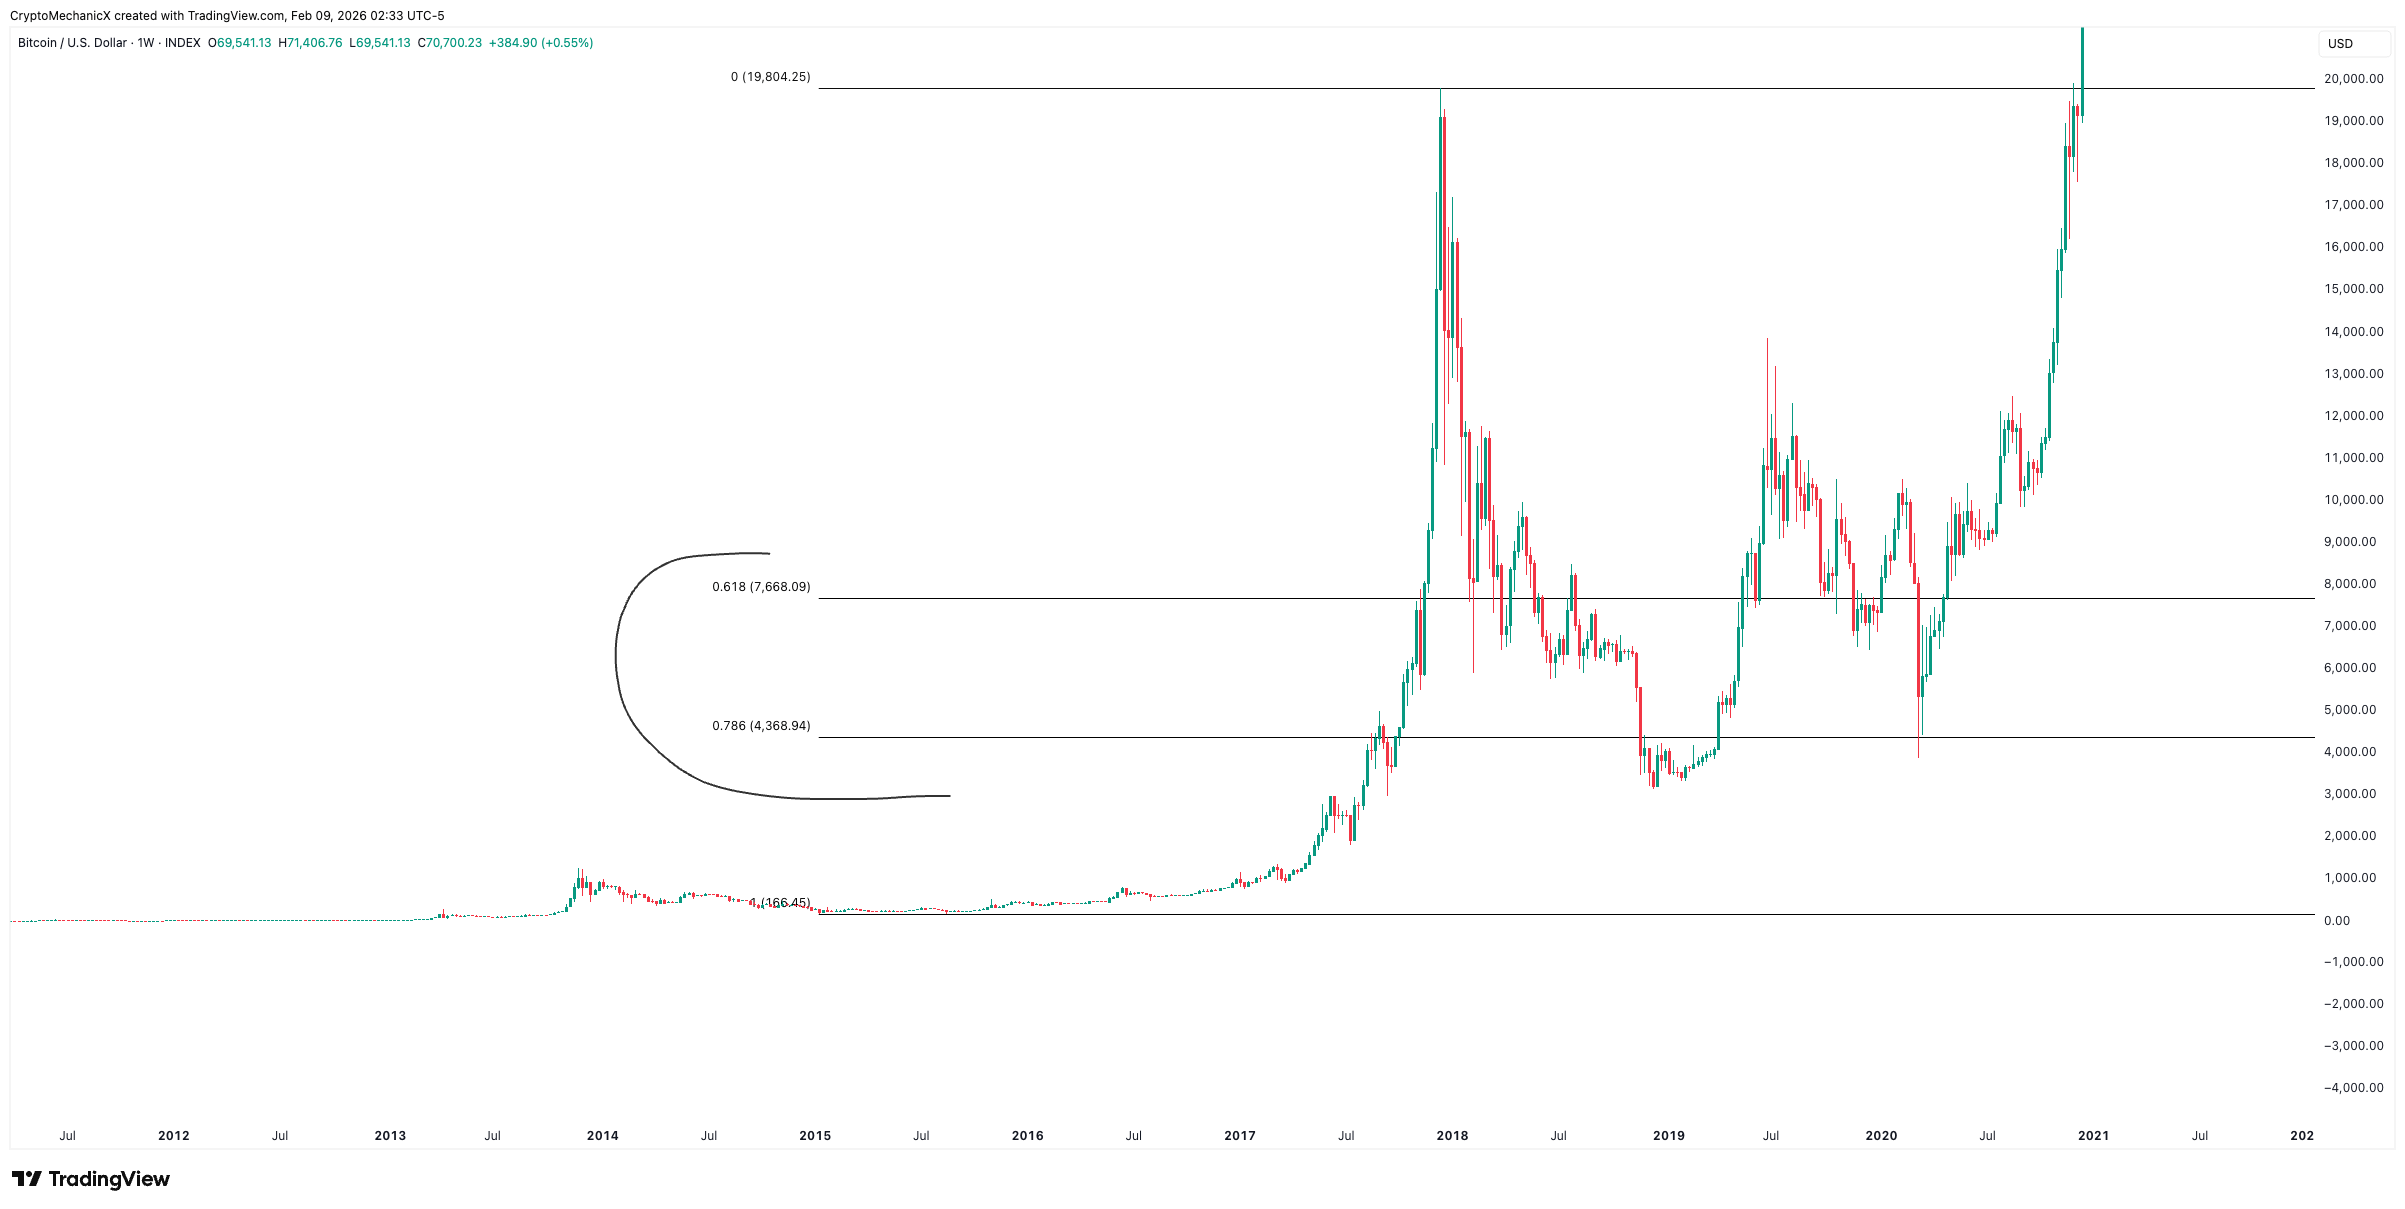
After the 2017 peak near $20K, Bitcoin retraced hard into the 0.786 Fibonacci zone around $4,368. That level later proved to be the ideal accumulation area before the 2020 to 2021 bull run.
2022 Bear Market
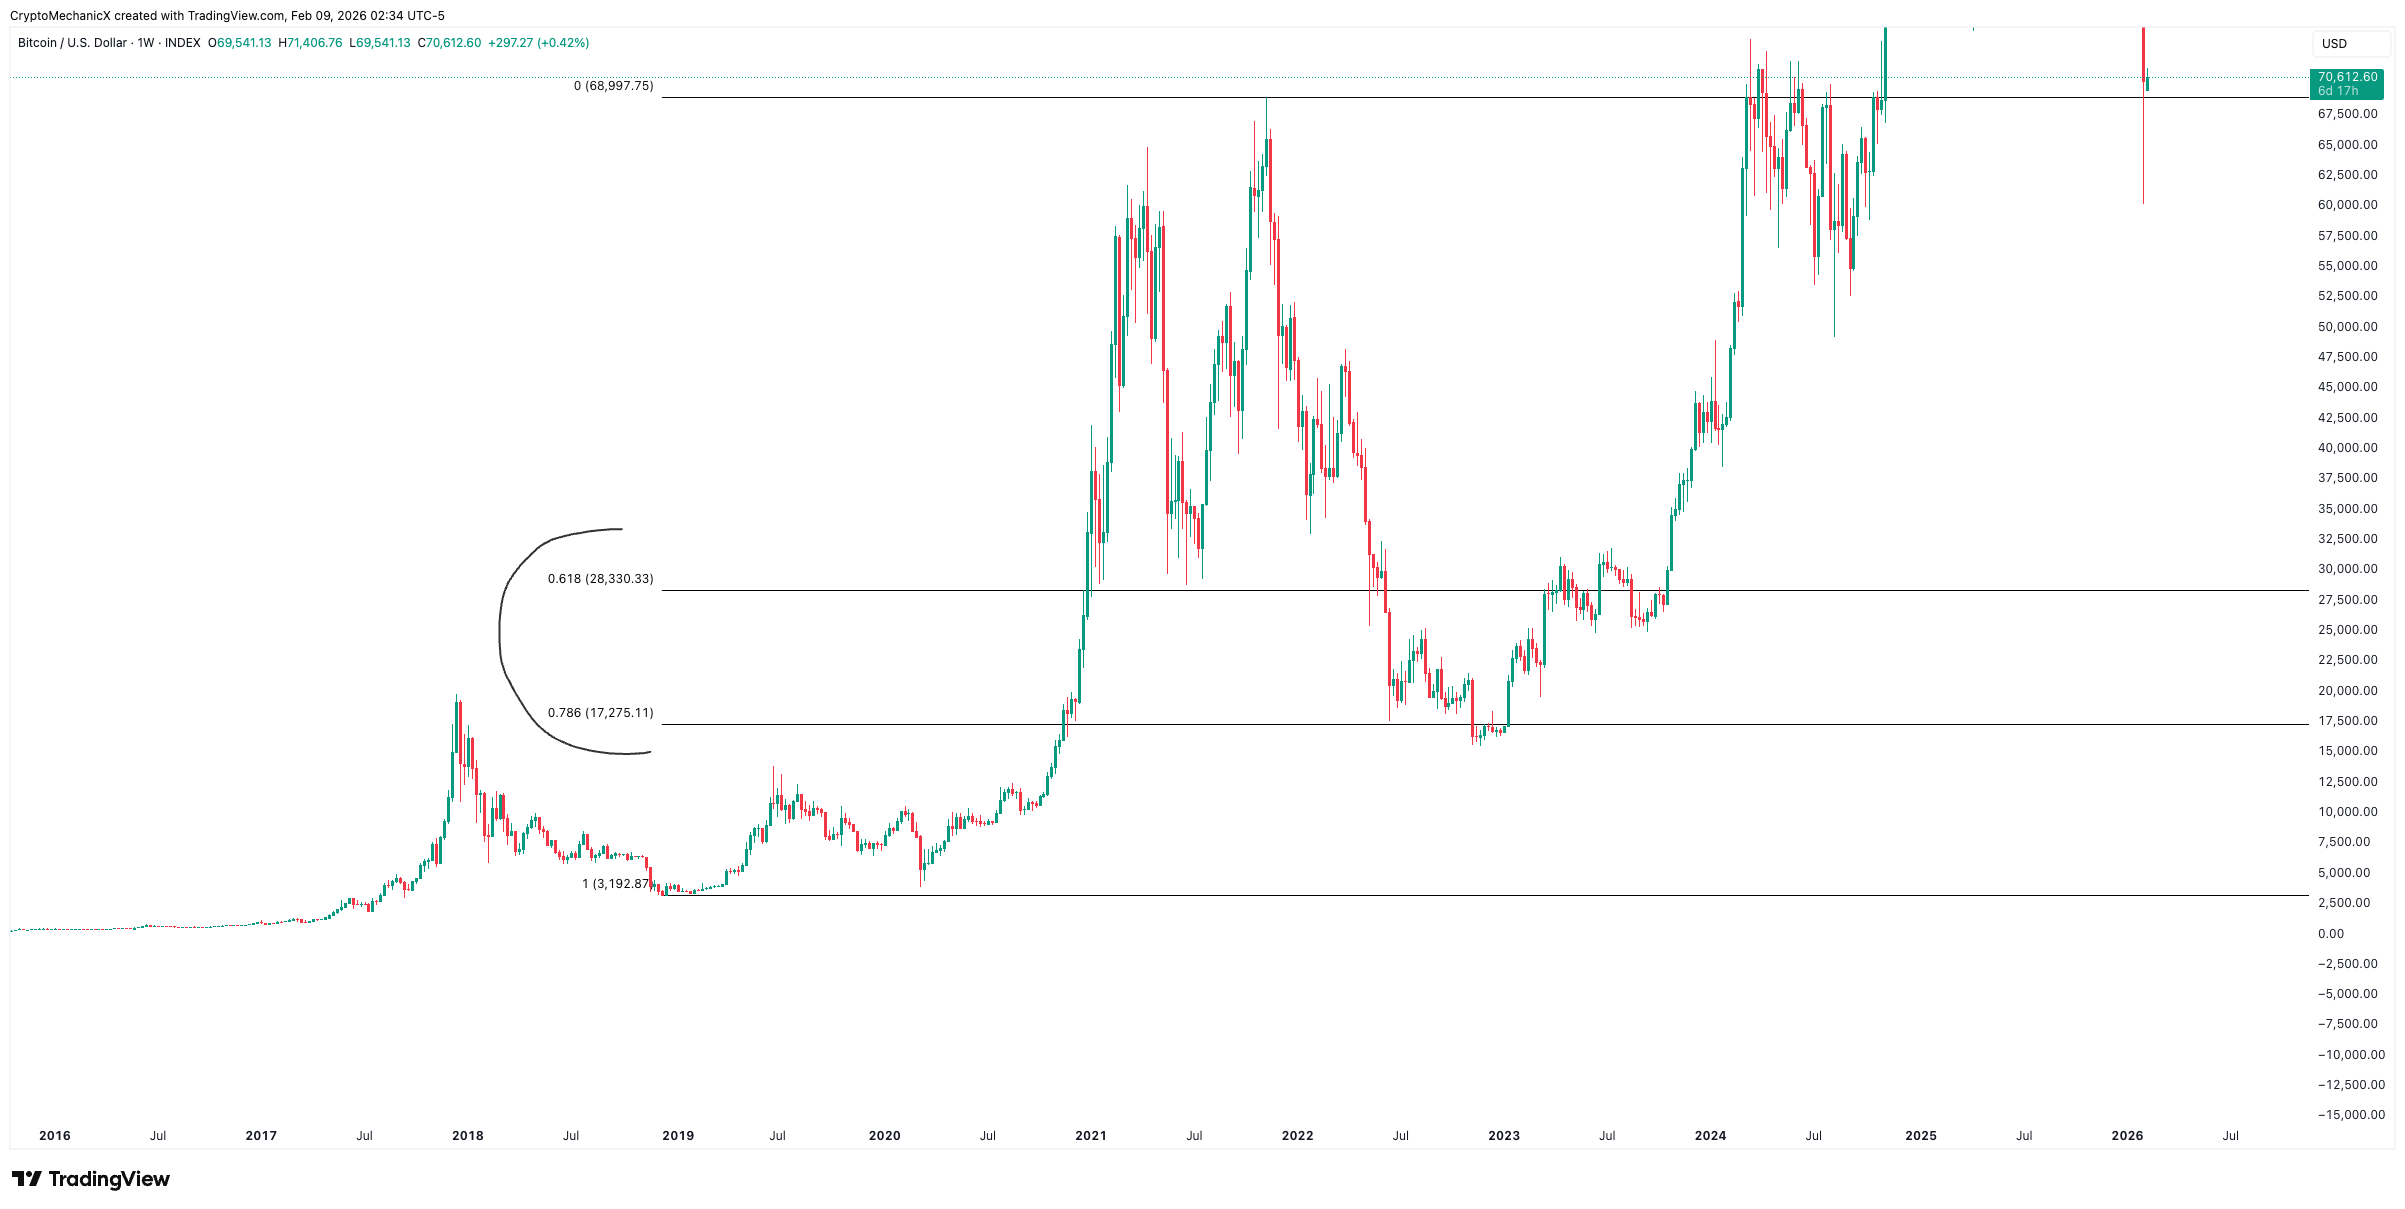
After the 2021 peak near $69K, Bitcoin retraced into the 0.786 Fibonacci level around $17,275, which again produced the cycle low before the 2023 to 2025 recovery phase.
05The 0.786 Fib: A Recurring Theme Across All Cycles
Here is something important to notice. In every single bear market, Bitcoin dropped below the 0.786 Fibonacci level, spent some time there building a base, and then started a new bull cycle. This is not a coincidence. It is a repeating structural pattern.
This is also why many investors are caught off guard. They expect a sharp V shaped recovery. Historically, Bitcoin likes to spend time consolidating before starting its next major move higher. That means you usually have enough time to accumulate if you are watching the right levels.
06The Current Cycle: Key Levels To Watch
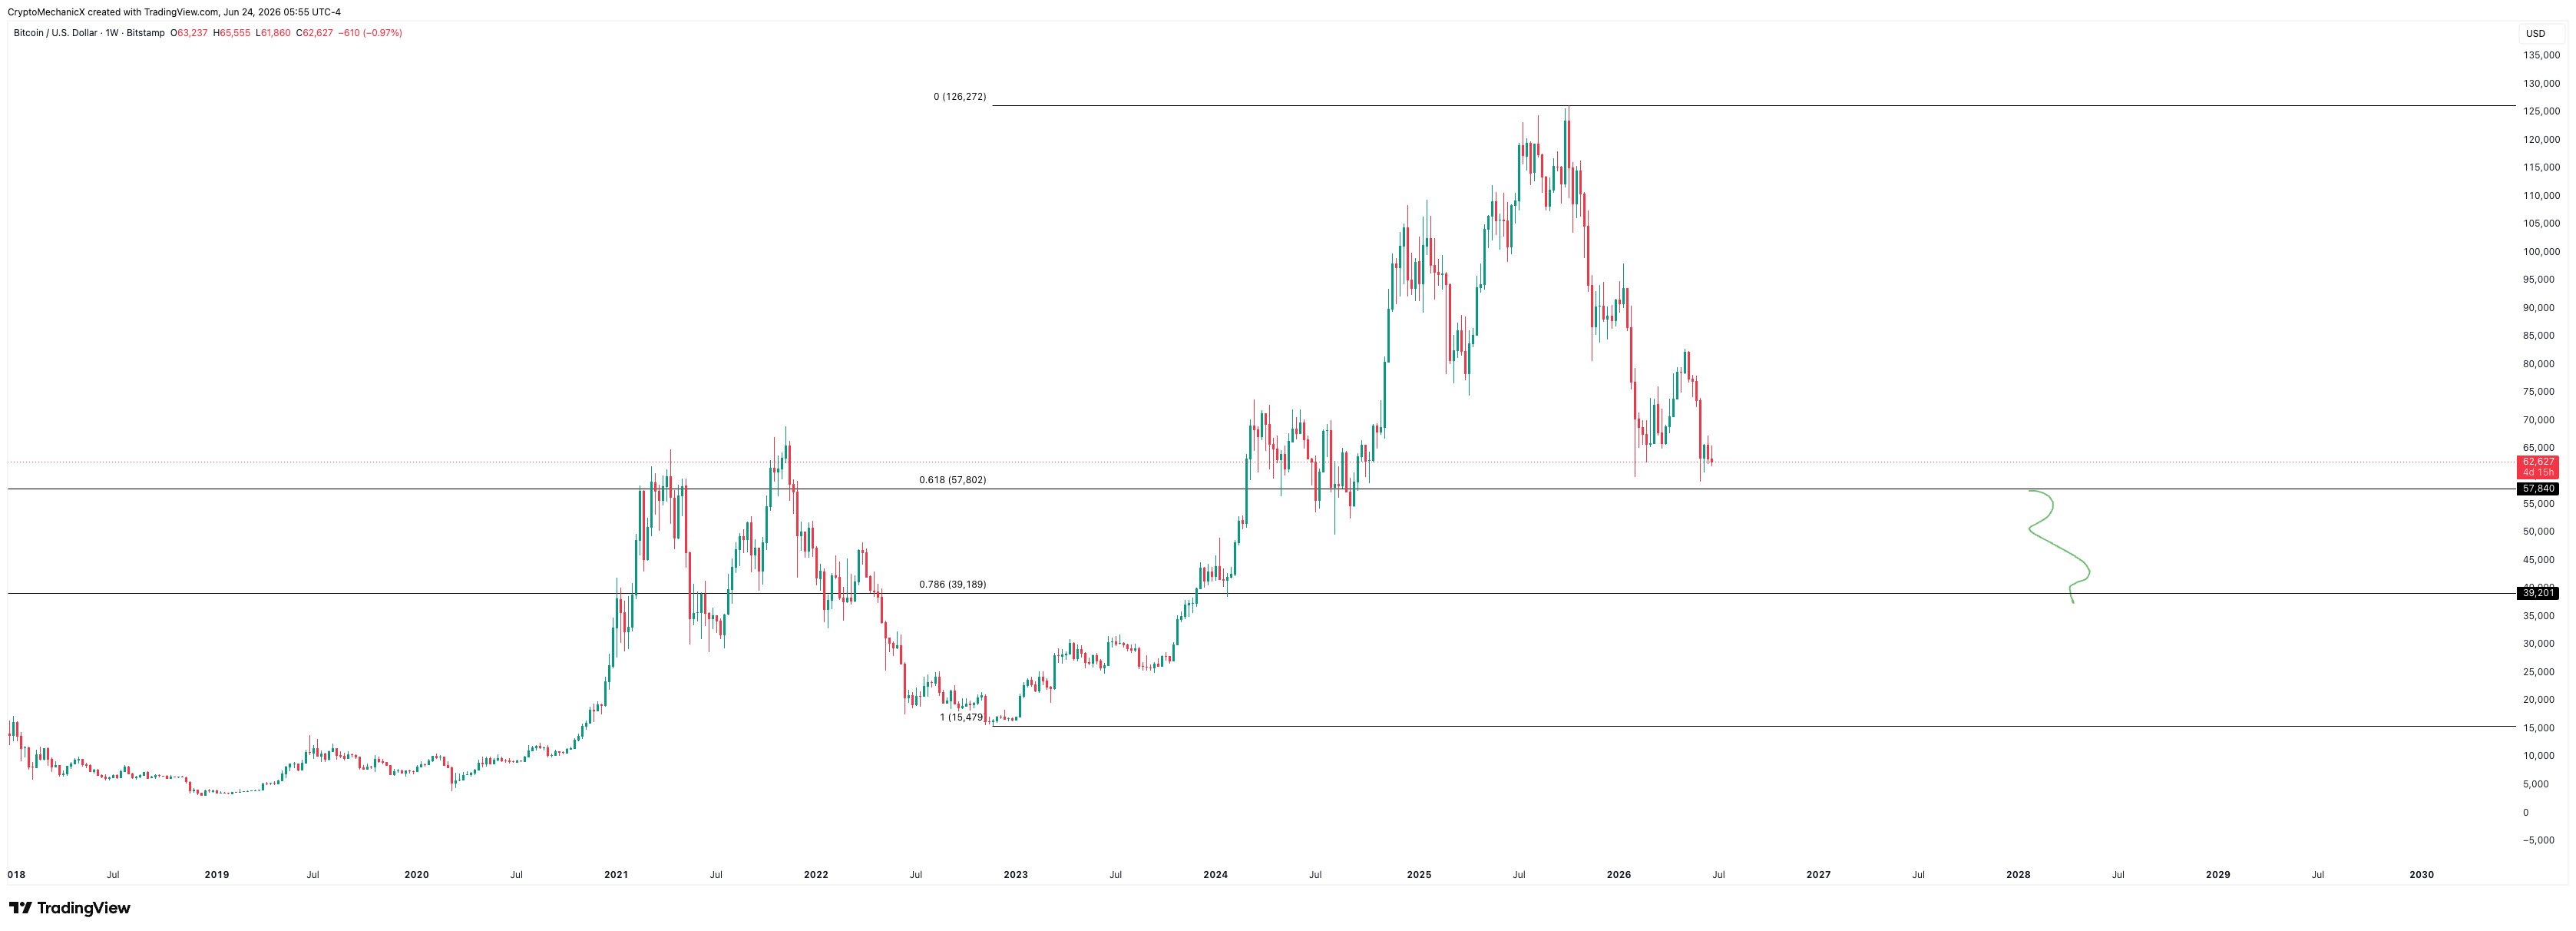
If Bitcoin follows the same pattern as previous cycles, the price could eventually fall into the historical Fibonacci 0.618 to 0.786 buy zone. Based on the current cycle's Fibonacci measurement from the last major low to the $126K top, those levels sit at approximately:
These are possible zones based on historical patterns. Not guaranteed targets. The market always has the right to do something different. These are areas to watch and prepare for, not blindly buy into.
07Why This Matters
Most people become excited near the top and scared near the bottom. Bitcoin cycles show that the best opportunities usually appear when the market feels most uncertain. This does not mean we buy blindly. It means we prepare our plan, wait for confirmation, and manage risk.
There are two approaches when price enters a Fibonacci zone:
Type One: You start accumulating as soon as Bitcoin enters the fib range, somewhere between the 0.618 and the 0.786. You do not need the perfect bottom. You just want to be positioned.
Type Two: You wait for the absolute bottom, targeting the 0.786 or lower, patient enough for full capitulation before you act.
Neither approach is wrong. It depends on your risk tolerance. The key is having a plan before the price arrives. Not reacting emotionally when it does. Time-based capitulation also matters: historically Bitcoin tends to bottom in Q4 of the bear market year, roughly one year after the cycle top.
Risk Disclaimer: This article is for education and market analysis only. It is not financial advice. Bitcoin is highly volatile and every trader or investor should do their own research and manage risk properly. Past cycle patterns do not guarantee future results.
Educational content only. Not financial advice. Trading involves risk.