Bitcoin at $82,500 Resistance: Will BTC Break Out?

Bitcoin is consolidating below a key lower high as we head into an important week for crypto. We are watching the $82,500 resistance area, the daily trading range and the market’s reaction to the CLARITY Act vote and Federal Reserve decision.
Our September 14, 2026 update starts with the monthly and weekly charts, then moves into the daily range and order flow. Volatility may increase around this week’s events, so we want to see how price responds before committing to a direction.
- ✓We are watching the $82,500 area for a potential change in Bitcoin’s higher timeframe structure.
- ✓The daily chart is consolidating around $76K–$81K after a sharp move higher.
- ✓Selling pressure without sustained downside may point to absorption, but we still need confirmation.
- ✓The September 15 CLARITY Act vote and September 16 Fed decision make patience especially important.
Educational content only. Not financial advice. This guide explains a trading framework and is not a recommendation to buy, sell or hold any asset.
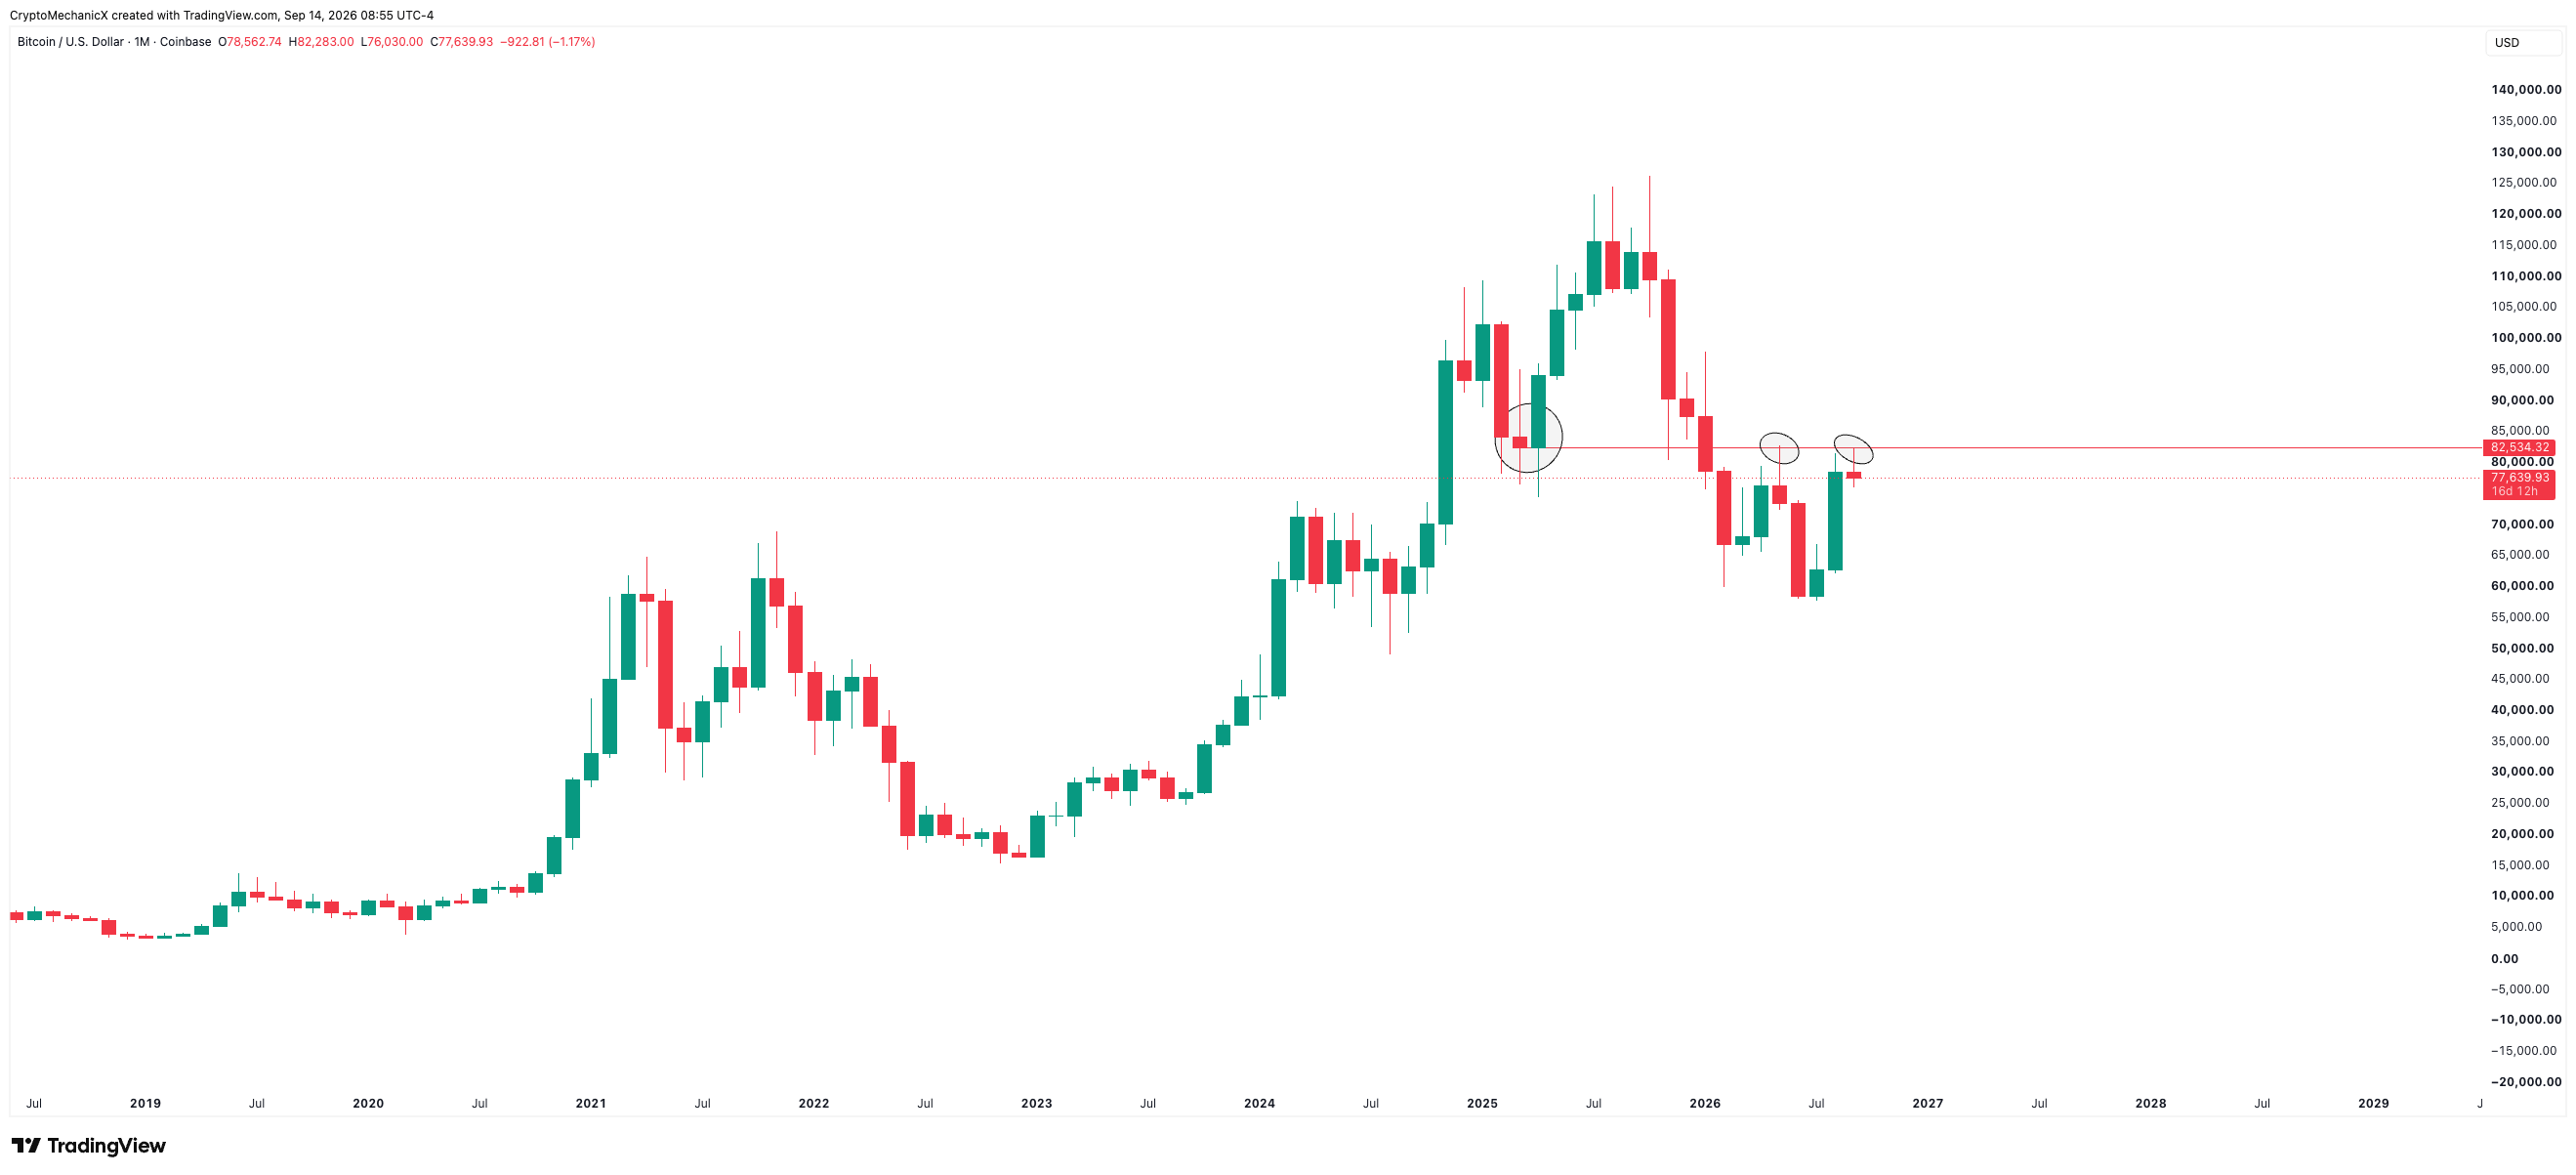
01Bitcoin Monthly Structure: Why $82,500 Matters
On our monthly chart, Bitcoin remains below the last lower-high area. We therefore still read the broader structure as bearish until price gives us evidence of a meaningful change.
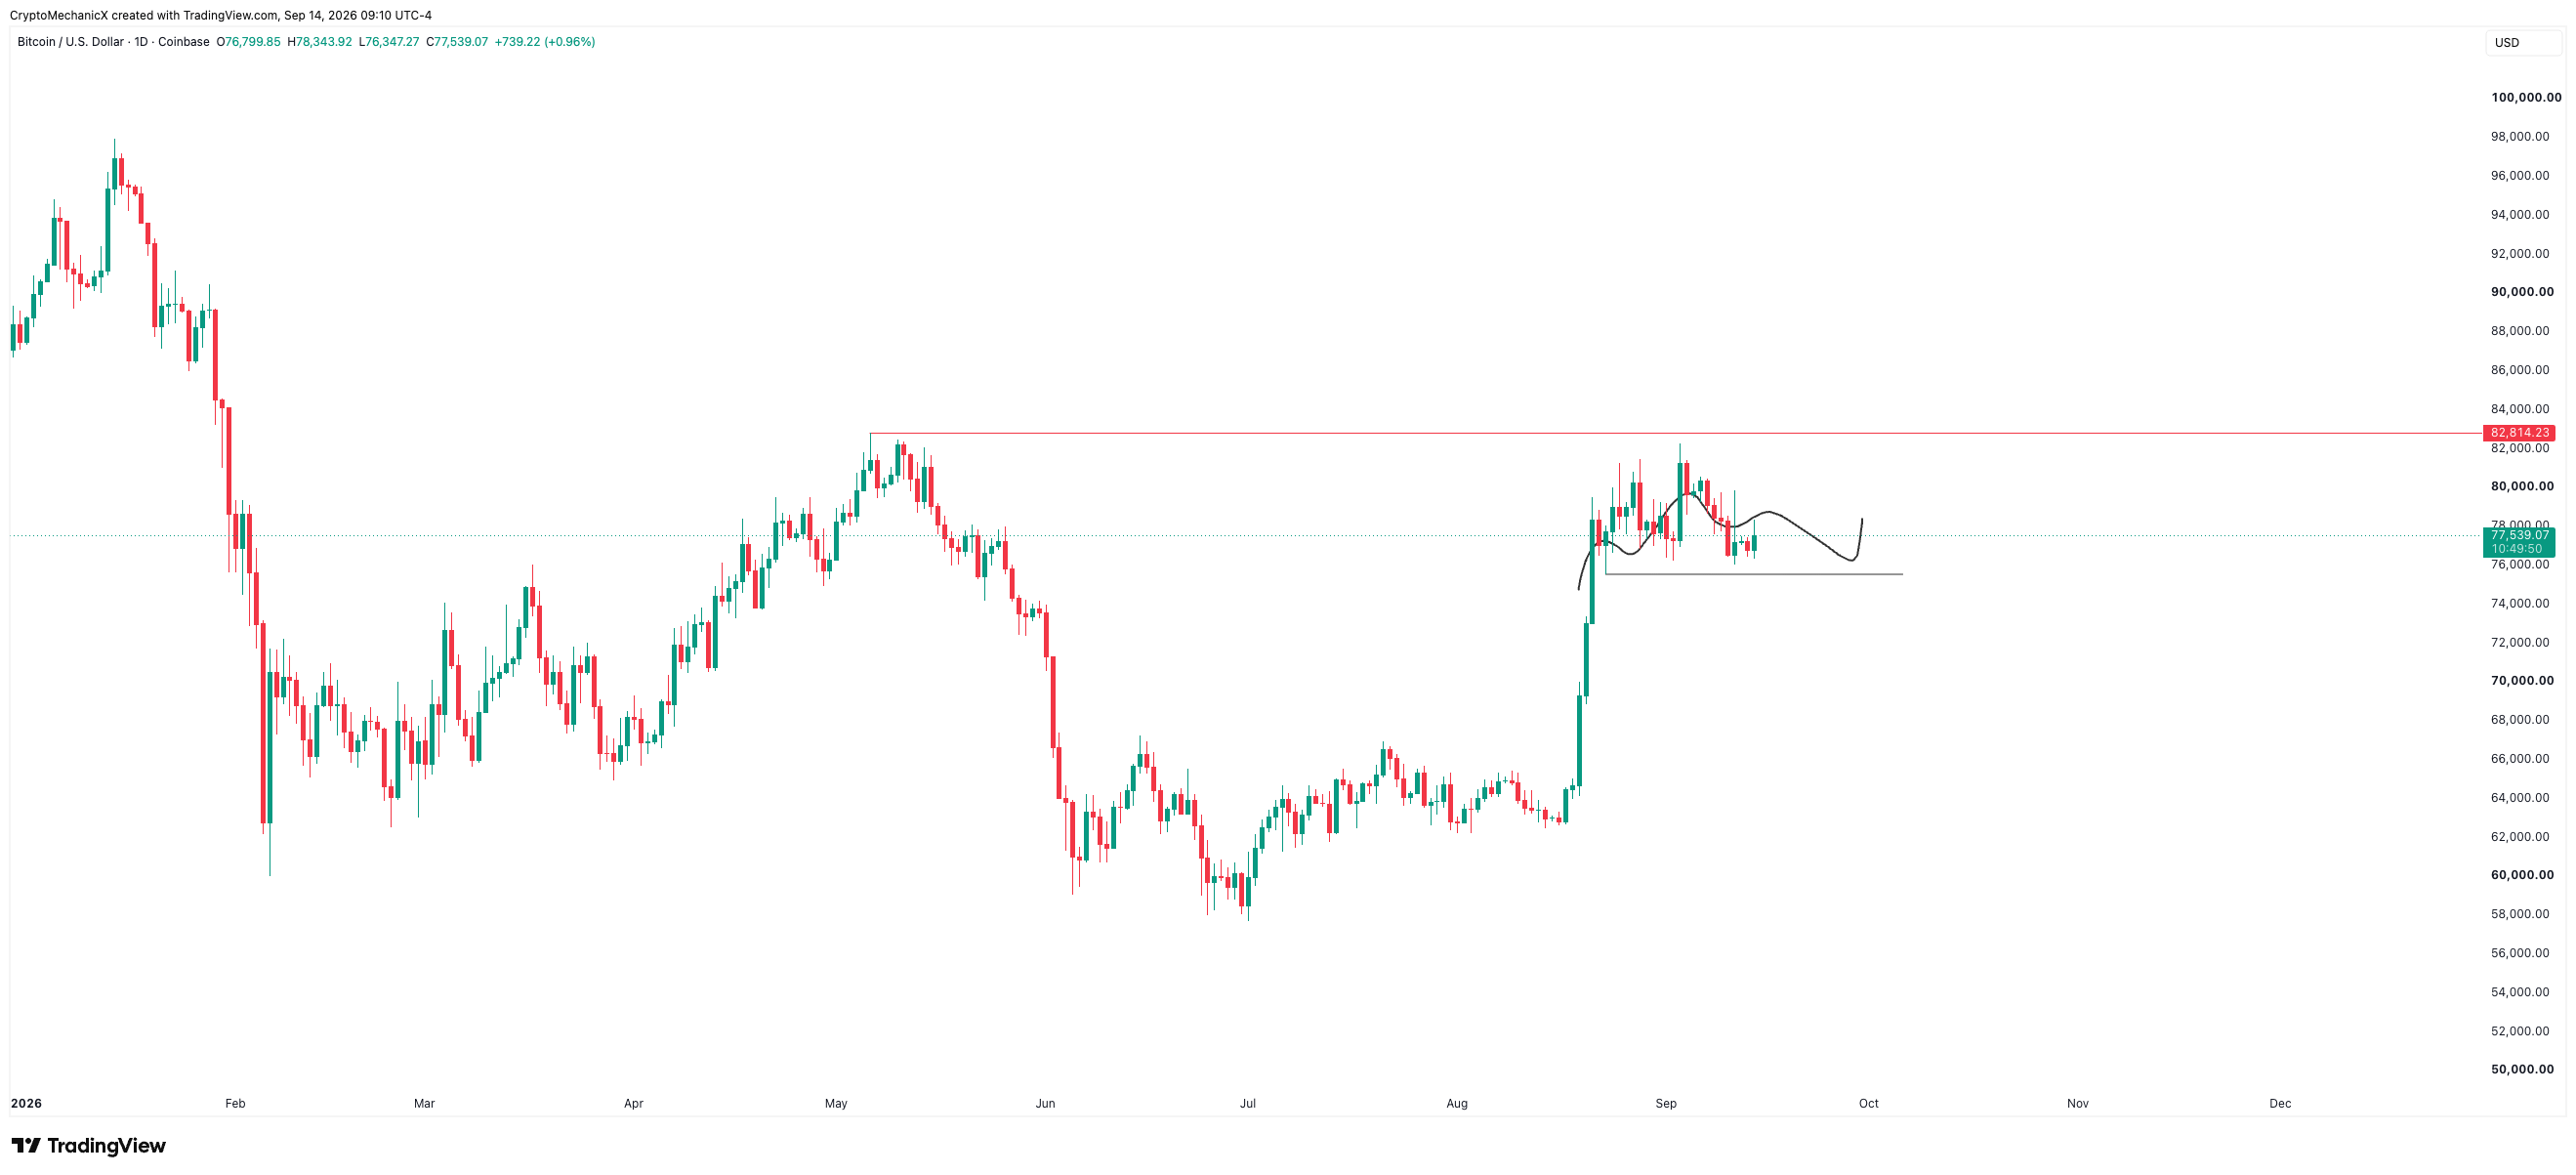
The $82,500 zone is important because it previously acted as support and is now acting as resistance. It also lines up with the monthly lower high, making this an area for bulls to reclaim and bears to defend.
02What Previous Bitcoin Cycles Show
We have observed a pattern in previous cycles: after Bitcoin lost monthly support, price continued lower. Once a low had formed and price returned to that same area, it eventually reclaimed the level.
The 2018 bear market and the decline following the 2021 peak provide examples on the chart below. The question now is whether Bitcoin can repeat that recovery at the current resistance zone.
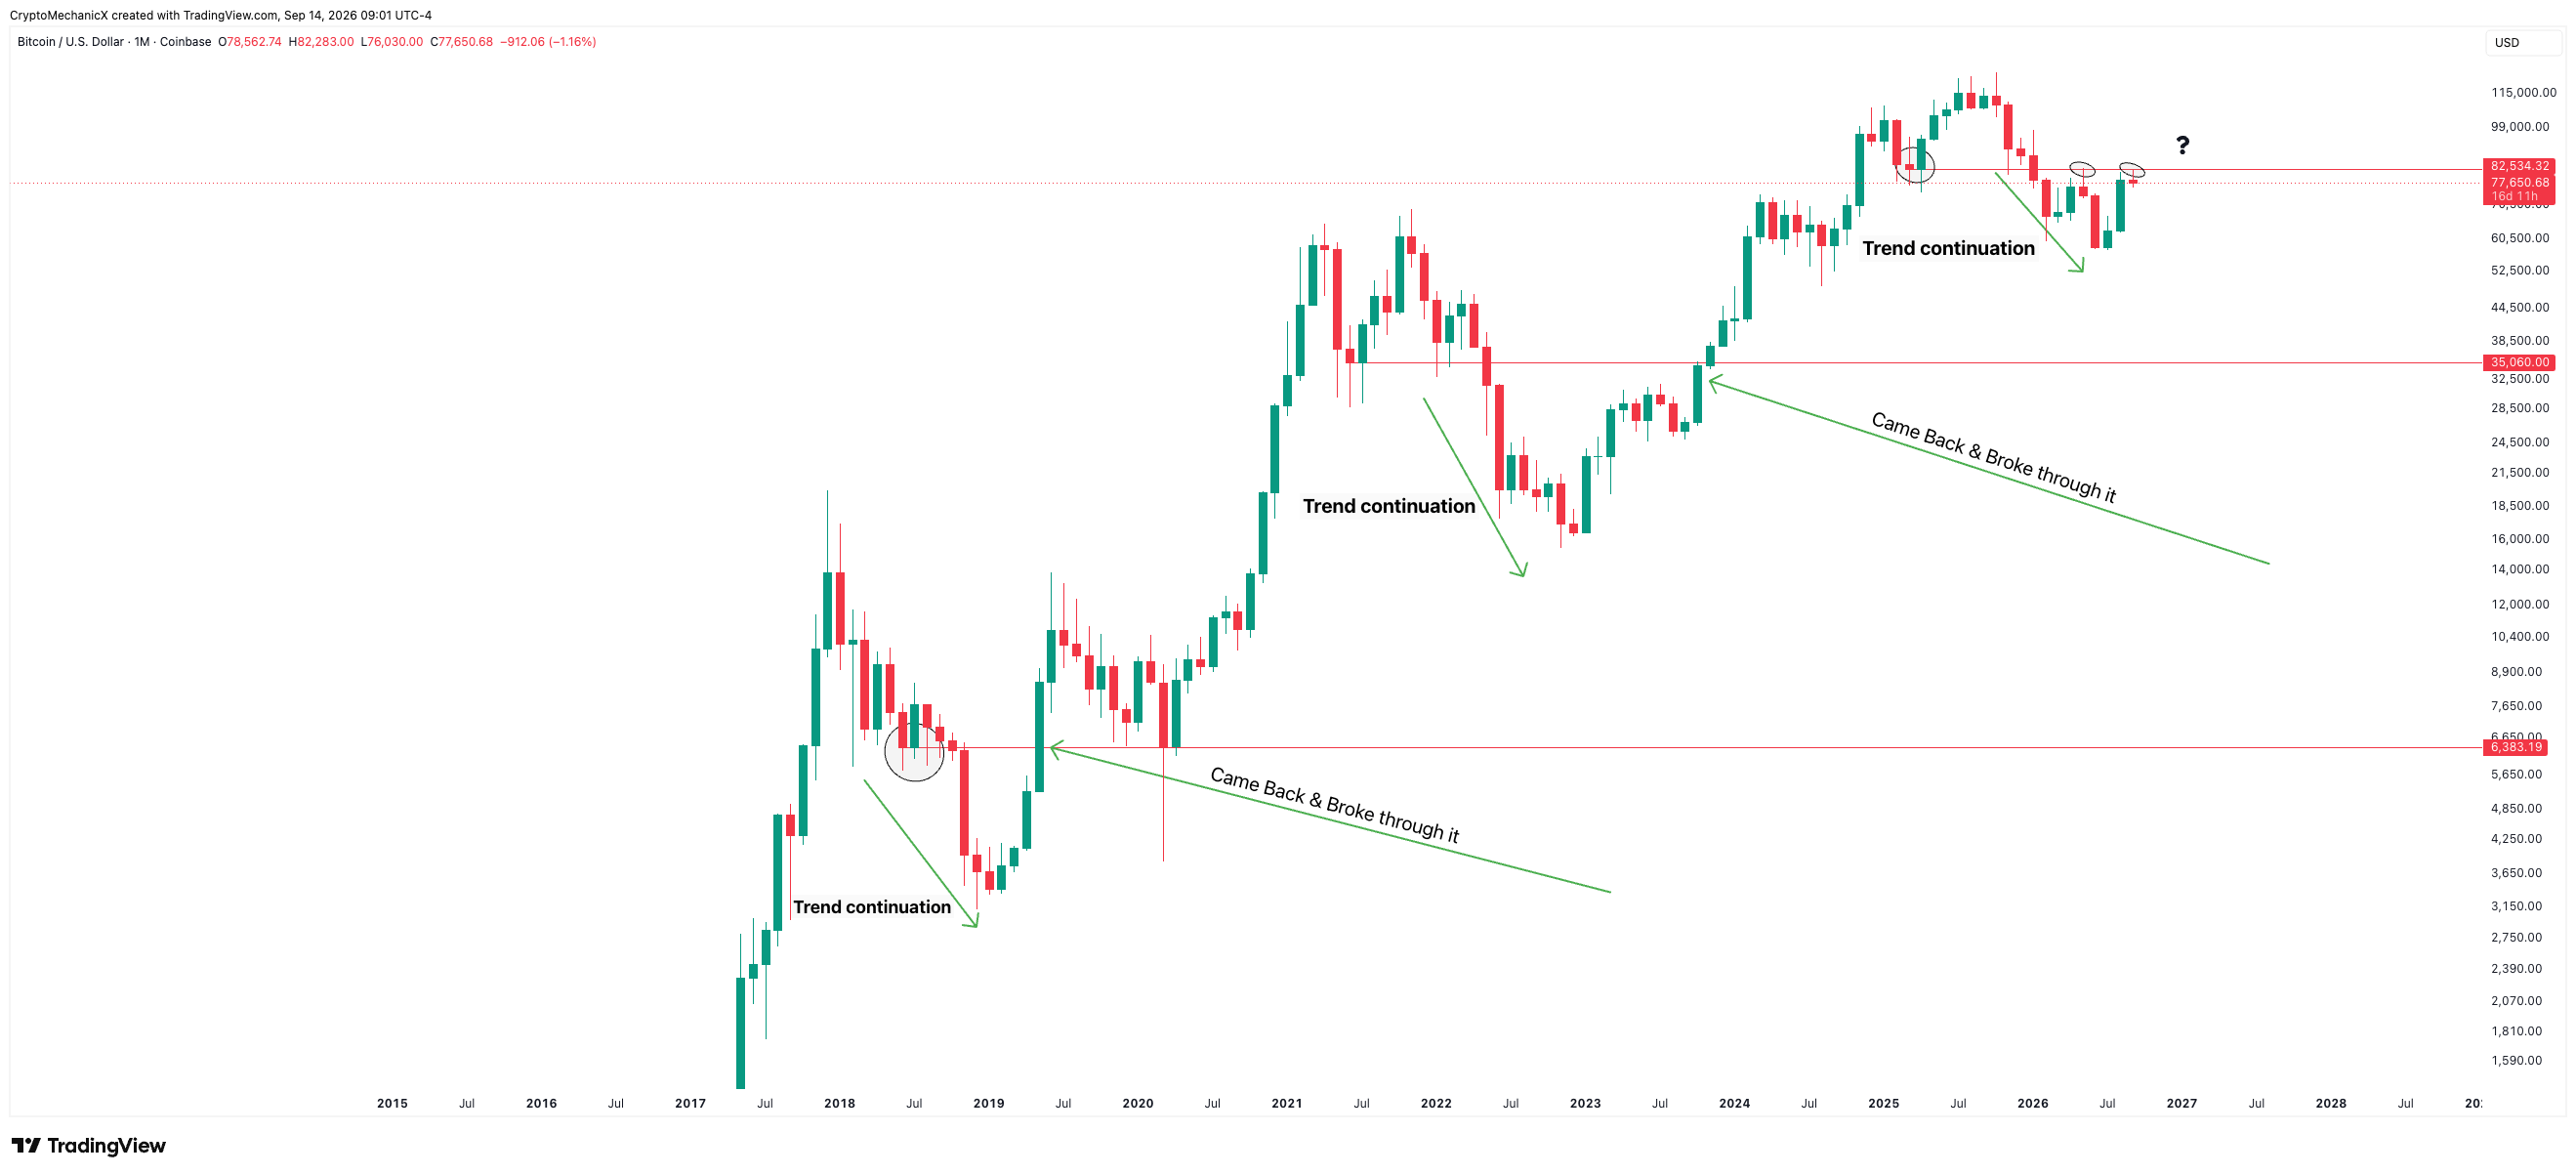
We use these comparisons to frame a scenario. We still need the current market to confirm it through price action.
03The Weekly Lower High Remains The Key Test
The weekly chart tells a similar story. While Bitcoin trades below the lower-high resistance area around $82,500, the bearish structure remains in place. That gives the downside case a technical basis.
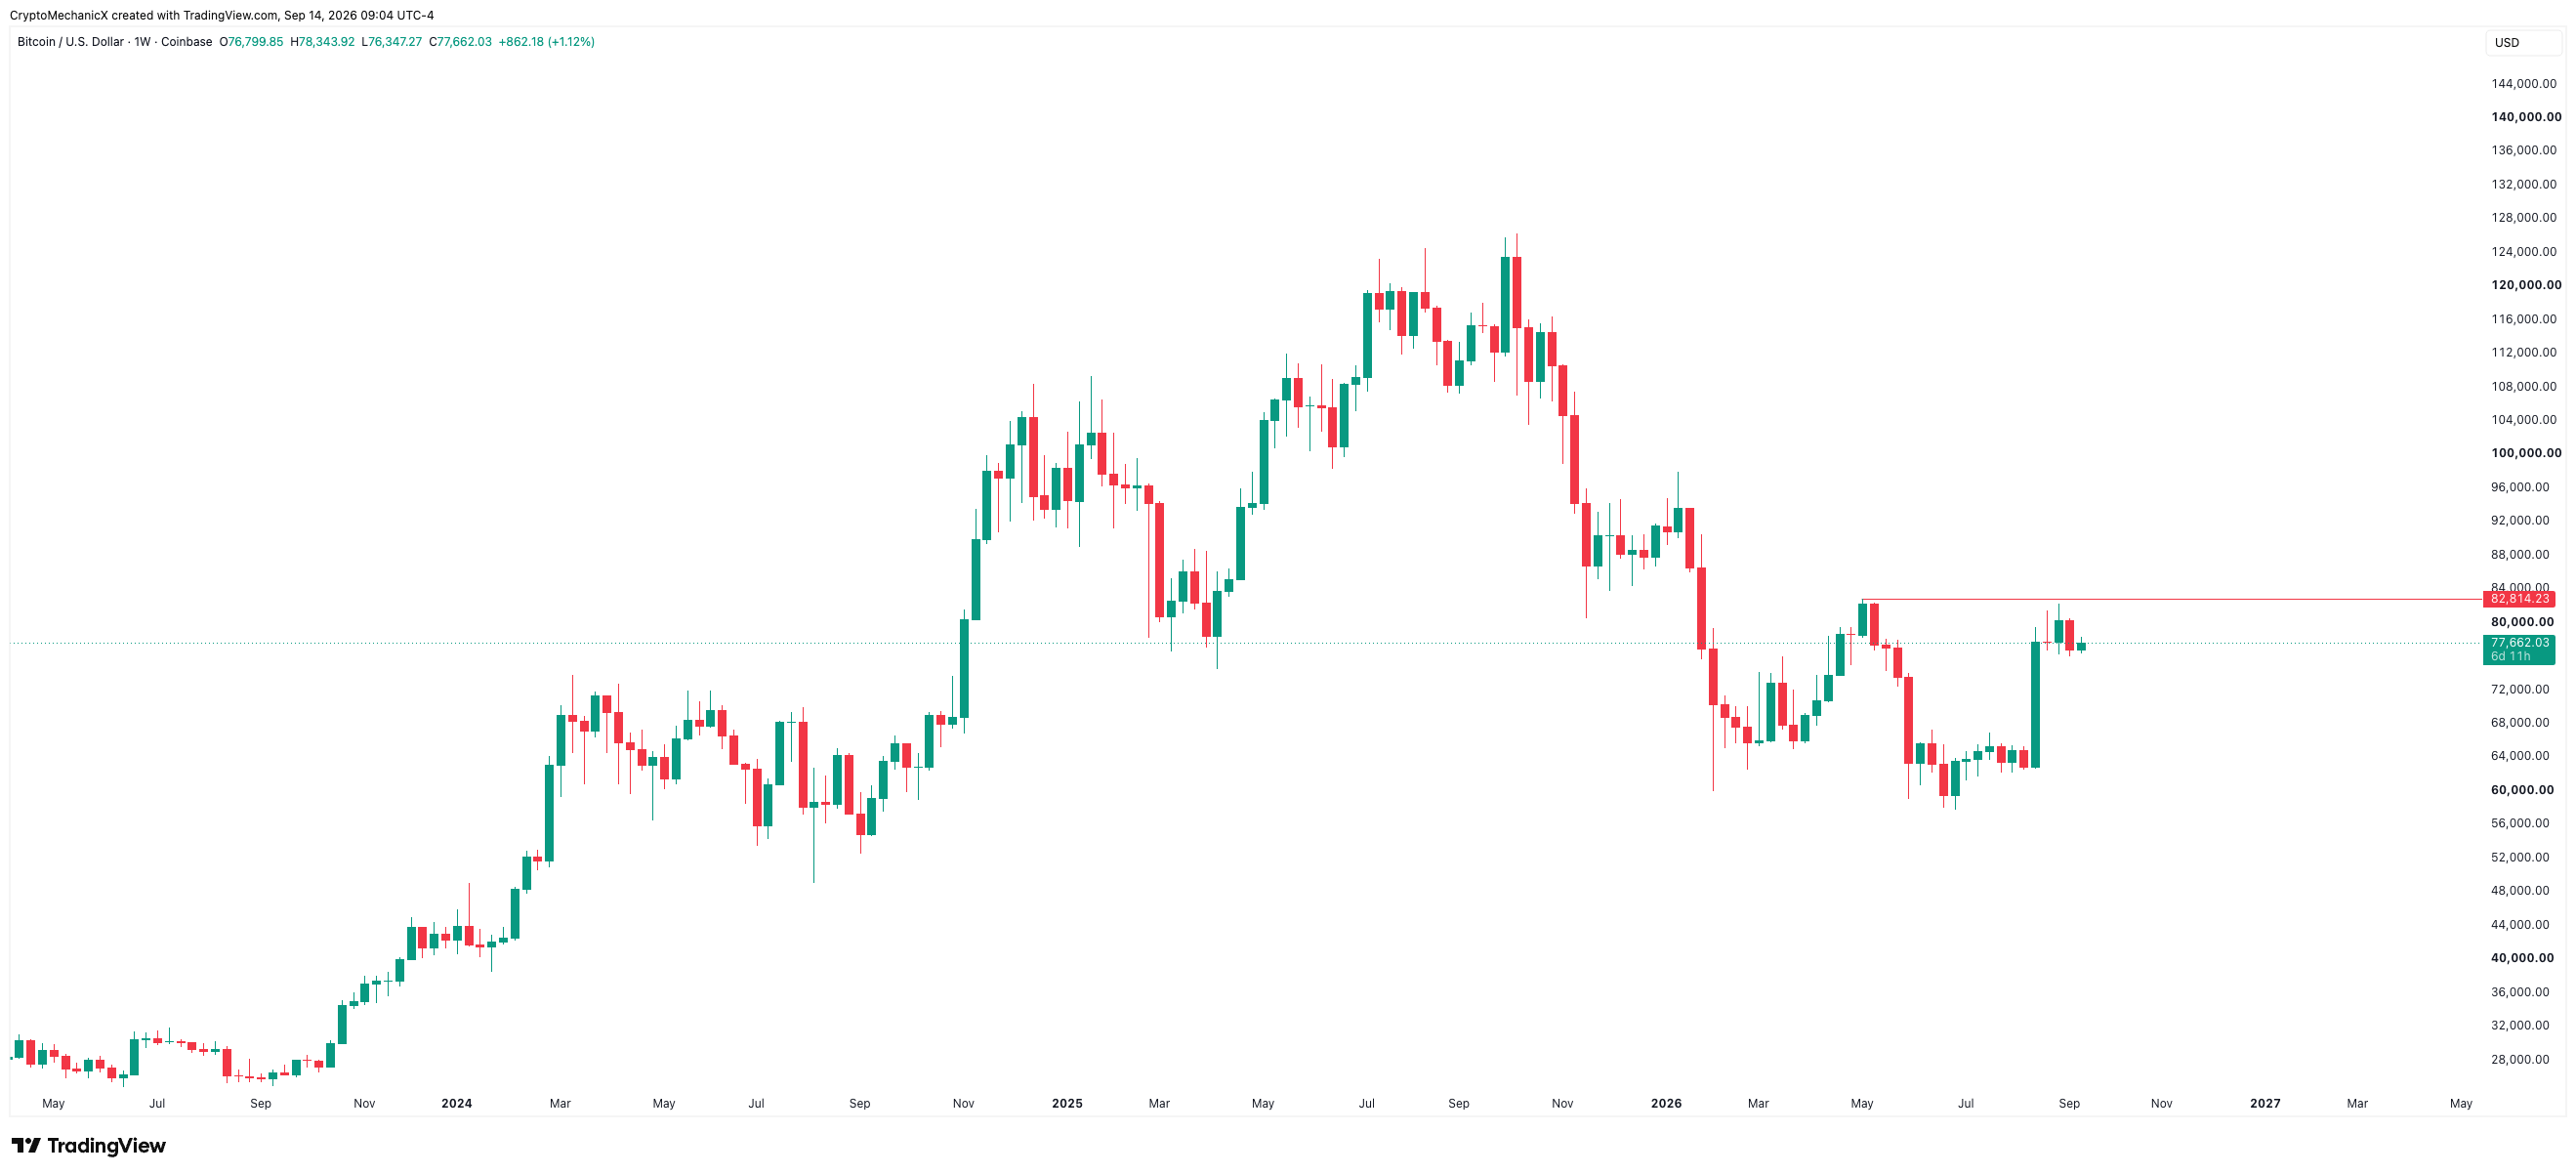
A sustained reclaim would give us a reason to reassess the expectation of another low. We would look for acceptance above resistance and follow-through rather than treating a brief move above the level as a confirmed trend change.
04Bitcoin Is Consolidating Around $76K–$81K
On the daily chart, Bitcoin has spent roughly three weeks consolidating around $76,000–$81,000, with occasional moves outside that range. After a strong move higher, we want to see price hold its gains instead of fading the entire advance.
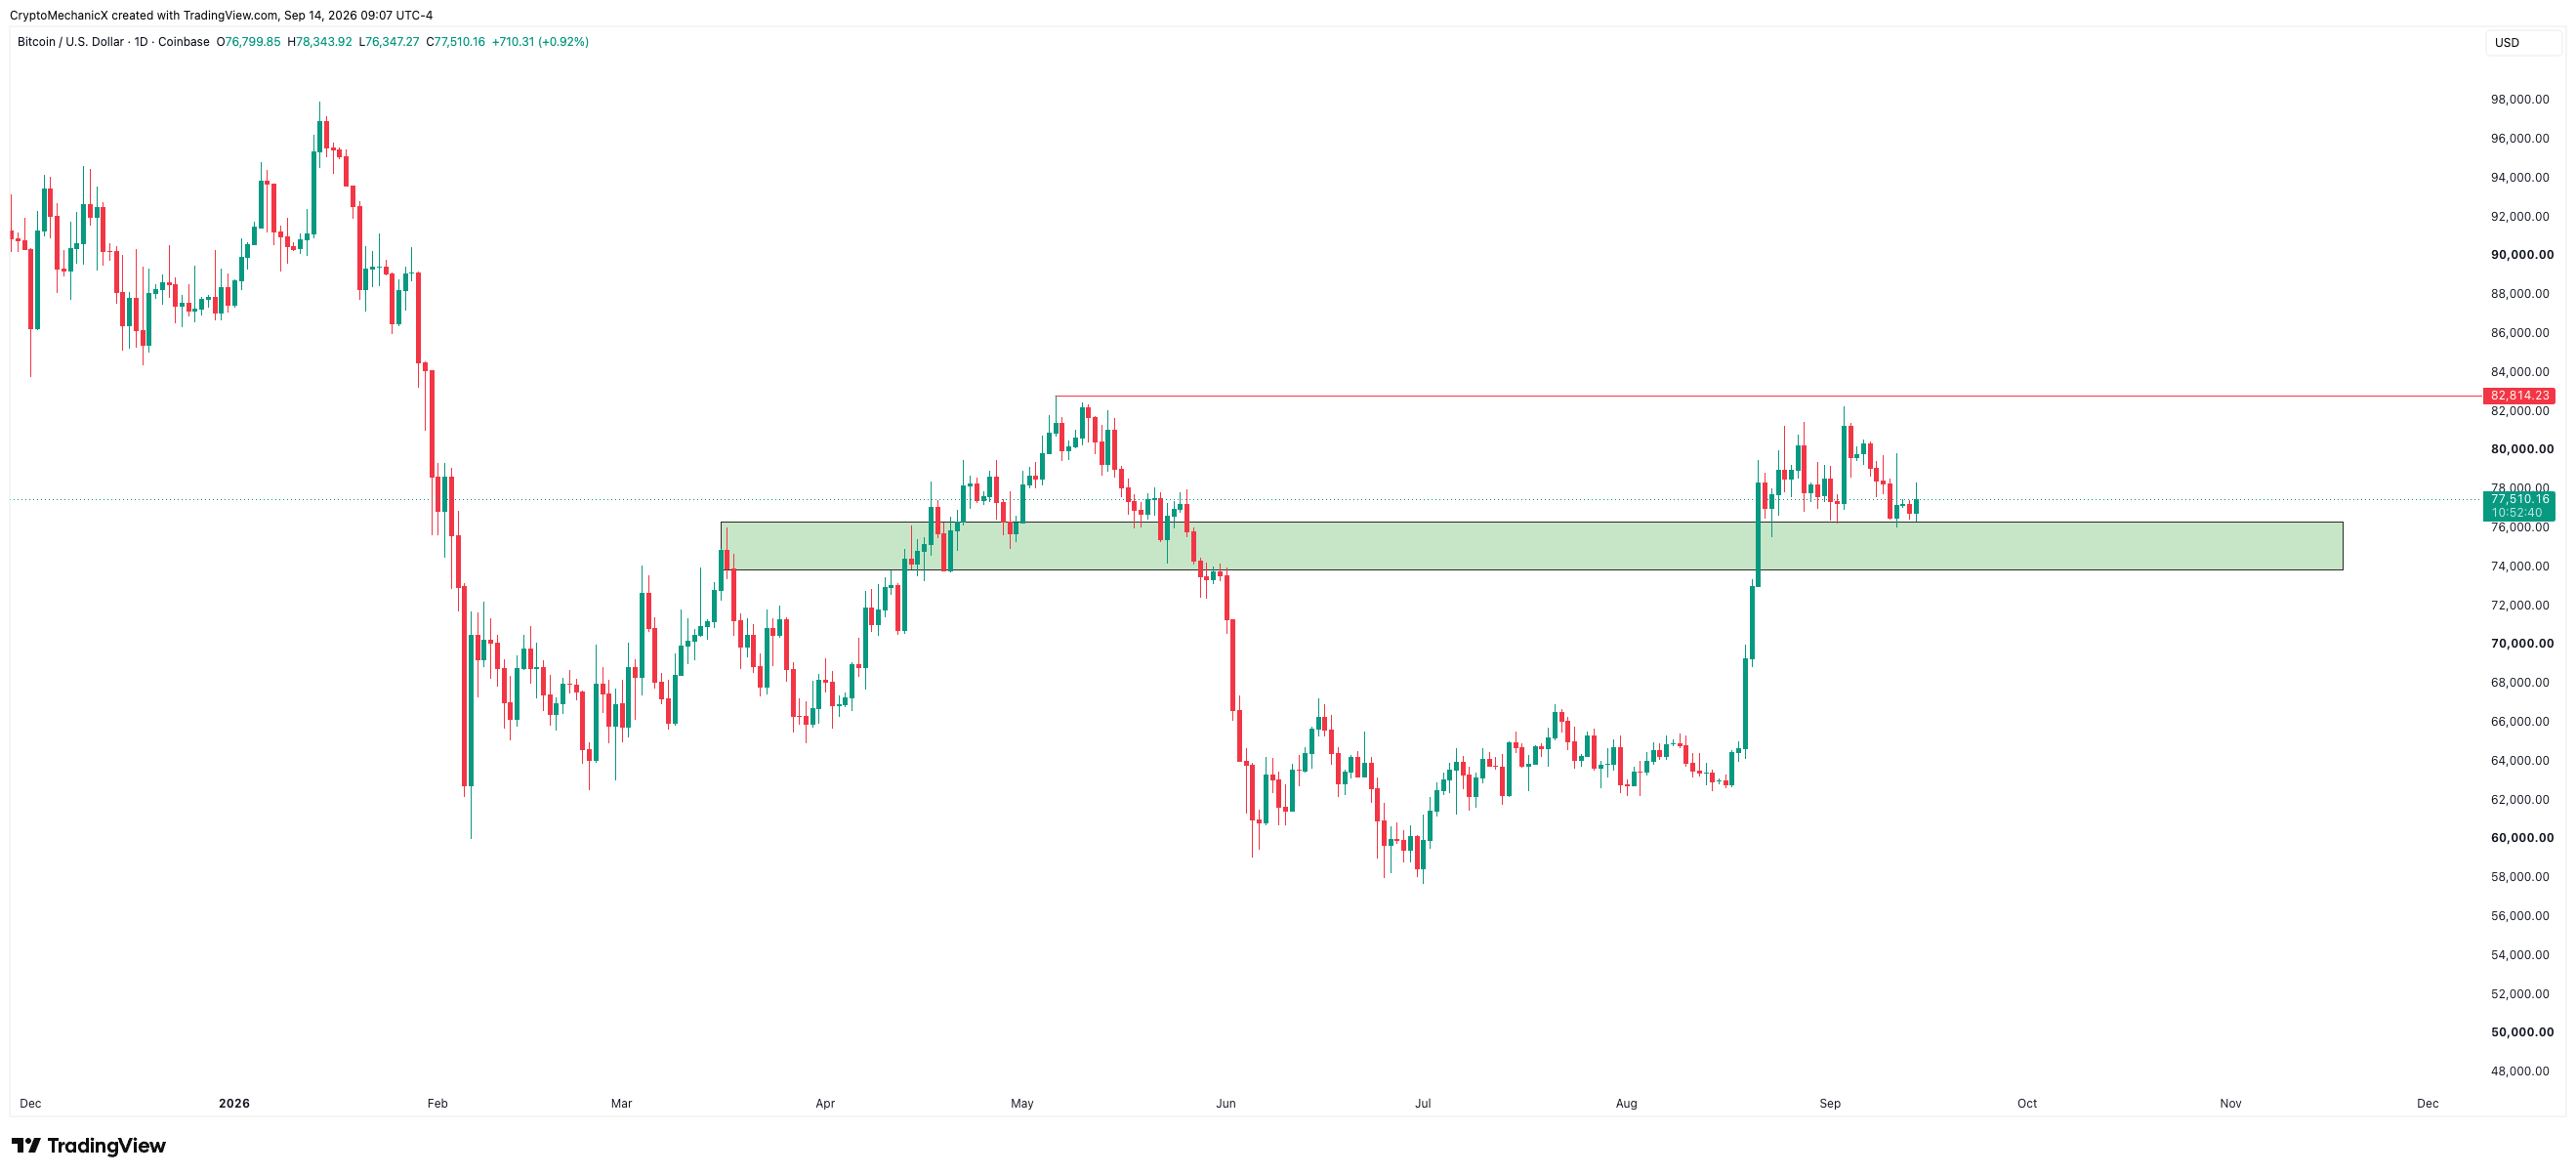
So far, price has remained in consolidation. That is worth watching, but it does not yet resolve the higher timeframe resistance overhead.
05Are Buyers Absorbing The Sellers?
There is a constructive element for bulls: Bitcoin continues to encounter selling pressure near $80,000, yet sellers have struggled to produce sustained downside.
When substantial selling is met by buyers and price holds up, it can suggest absorption. The longer that behaviour persists beneath supply, the more closely we watch for a potential breakout. Time spent in a range alone, however, does not prove that supply has been exhausted.
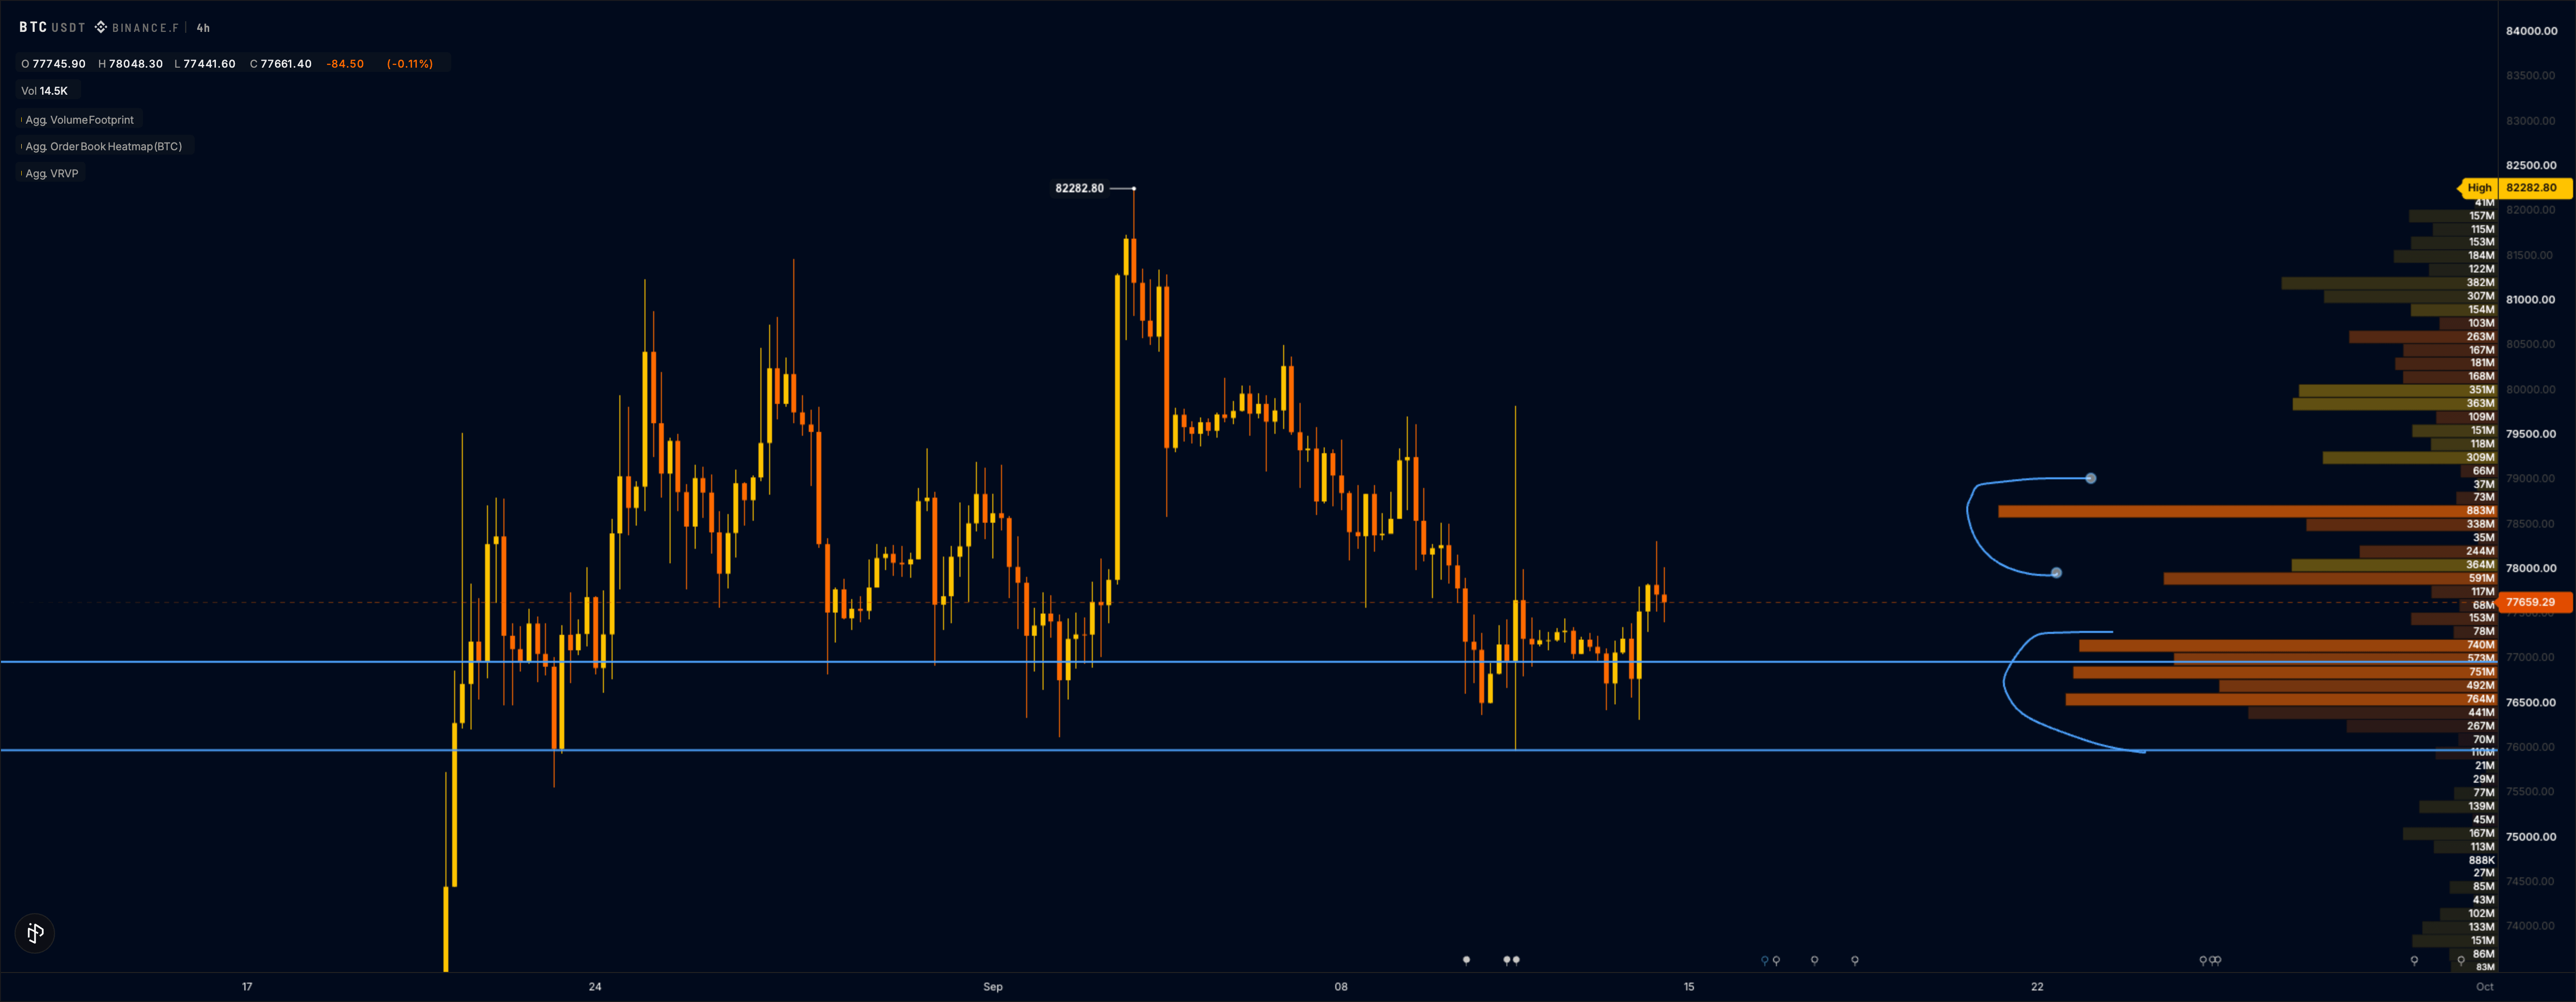
We want to see whether buyers can continue defending the range and eventually push through resistance. Our free Order Flow course explains how we read the relationship between trading activity and price response.
06CLARITY Act And FOMC: This Week’s Catalysts
CLARITY Act vote — September 15
The Senate is preparing for a vote on the Digital Asset Market Clarity Act on September 15, according to Senator Cynthia Lummis’s September 10 announcement. We are watching whether the legislation advances and how the crypto market responds.
Federal Reserve decision — September 16
The Federal Reserve’s official calendar lists the FOMC meeting for September 15–16. The decision on Wednesday is the other major event in our weekly outlook.

The original update highlights the possibility of a 25 basis point rate hike. We treat that as an event scenario rather than a confirmed outcome. Higher rates can weigh on risk assets, but the reaction also depends on what markets have already priced in and what the Fed communicates.
07What We Are Watching Next
- Range support: can Bitcoin continue holding around the lower end of the $76K–$81K consolidation?
- Selling pressure: does heavy selling continue to produce limited downside?
- Resistance: can price reclaim and hold the $82,500 area with follow-through?
- Event reaction: how does Bitcoin behave after the CLARITY Act vote and the Fed decision?
If buyers hold the range through these events, a breakout of the weekly lower high becomes a scenario worth watching. If support gives way or resistance produces another strong rejection, we will reassess the constructive daily picture.
We are waiting for the market to show its direction. Holding up under pressure is encouraging; confirmation still matters.
For this update, our approach is to avoid new entries until the FOMC decision and wait for clearer direction. We do not need to force a trade while the market is uncertain. For a broader framework, read our guide to positioning for the next big move.
Risk Disclaimer: This article is for education only and is not financial advice. Trading requires patience, discipline and experience. Crypto assets are volatile, so we must do our own research and manage risk carefully.
This update was adapted for our website from our original Binance Square article.
Educational content only. Not financial advice. Trading involves risk.