Bitcoin Update: Bad Macro, Stocks Crashing, BTC Still Above $80K

There’s hardly anything happening right now that could improve public sentiment. Almost everything is pushing market sentiment further to the downside.
Yields are up, the DXY is up, oil prices are up, and inflation is rising, equities are down.
The crypto market is struggling. Some altcoins are already down 30–40% on average.
There’s simply too much going on in the world right now. People were even calling for a “Black Monday,” expecting a massive sell-off in the stock market.
Despite all of this, Bitcoin is still managing to hold above $80,000, which is obviously not a bad sign.
Since most of us are primarily involved in crypto trading, we’ll keep our focus on the crypto market.
In this article, I’ll briefly discuss Bitcoin, what I think could happen next, and how I’m looking at the market based on my own analysis.
01BTCUSD (Monthly)
Some thoughts before we begin
We’ll start with the monthly chart, and I’ll keep my focus on market structure, what the price is currently doing, and whether there are any fakeouts to be aware of, We’ll look at things from a structural perspective.
Why do I want to focus on structure? Because I do believe we’re in the initial phase of the bull market, and this is the phase where high-timeframe structures begin to shift. We’ve already seen that high-timeframe structural shift, which is why I want to keep my focus on structure when analyzing the higher timeframes.
The pullbacks, fakeouts, and other short-term movements we see along the way are often just lower-timeframe noise that can shake people out of their positions.
I believe we’re in the early stages of the bull market. I don’t know how others are looking at it, but that’s how I see the market right now. And as long as that remains my broader outlook, I’ll continue to prioritize market structure over the noise on lower timeframes.
Monthly chart
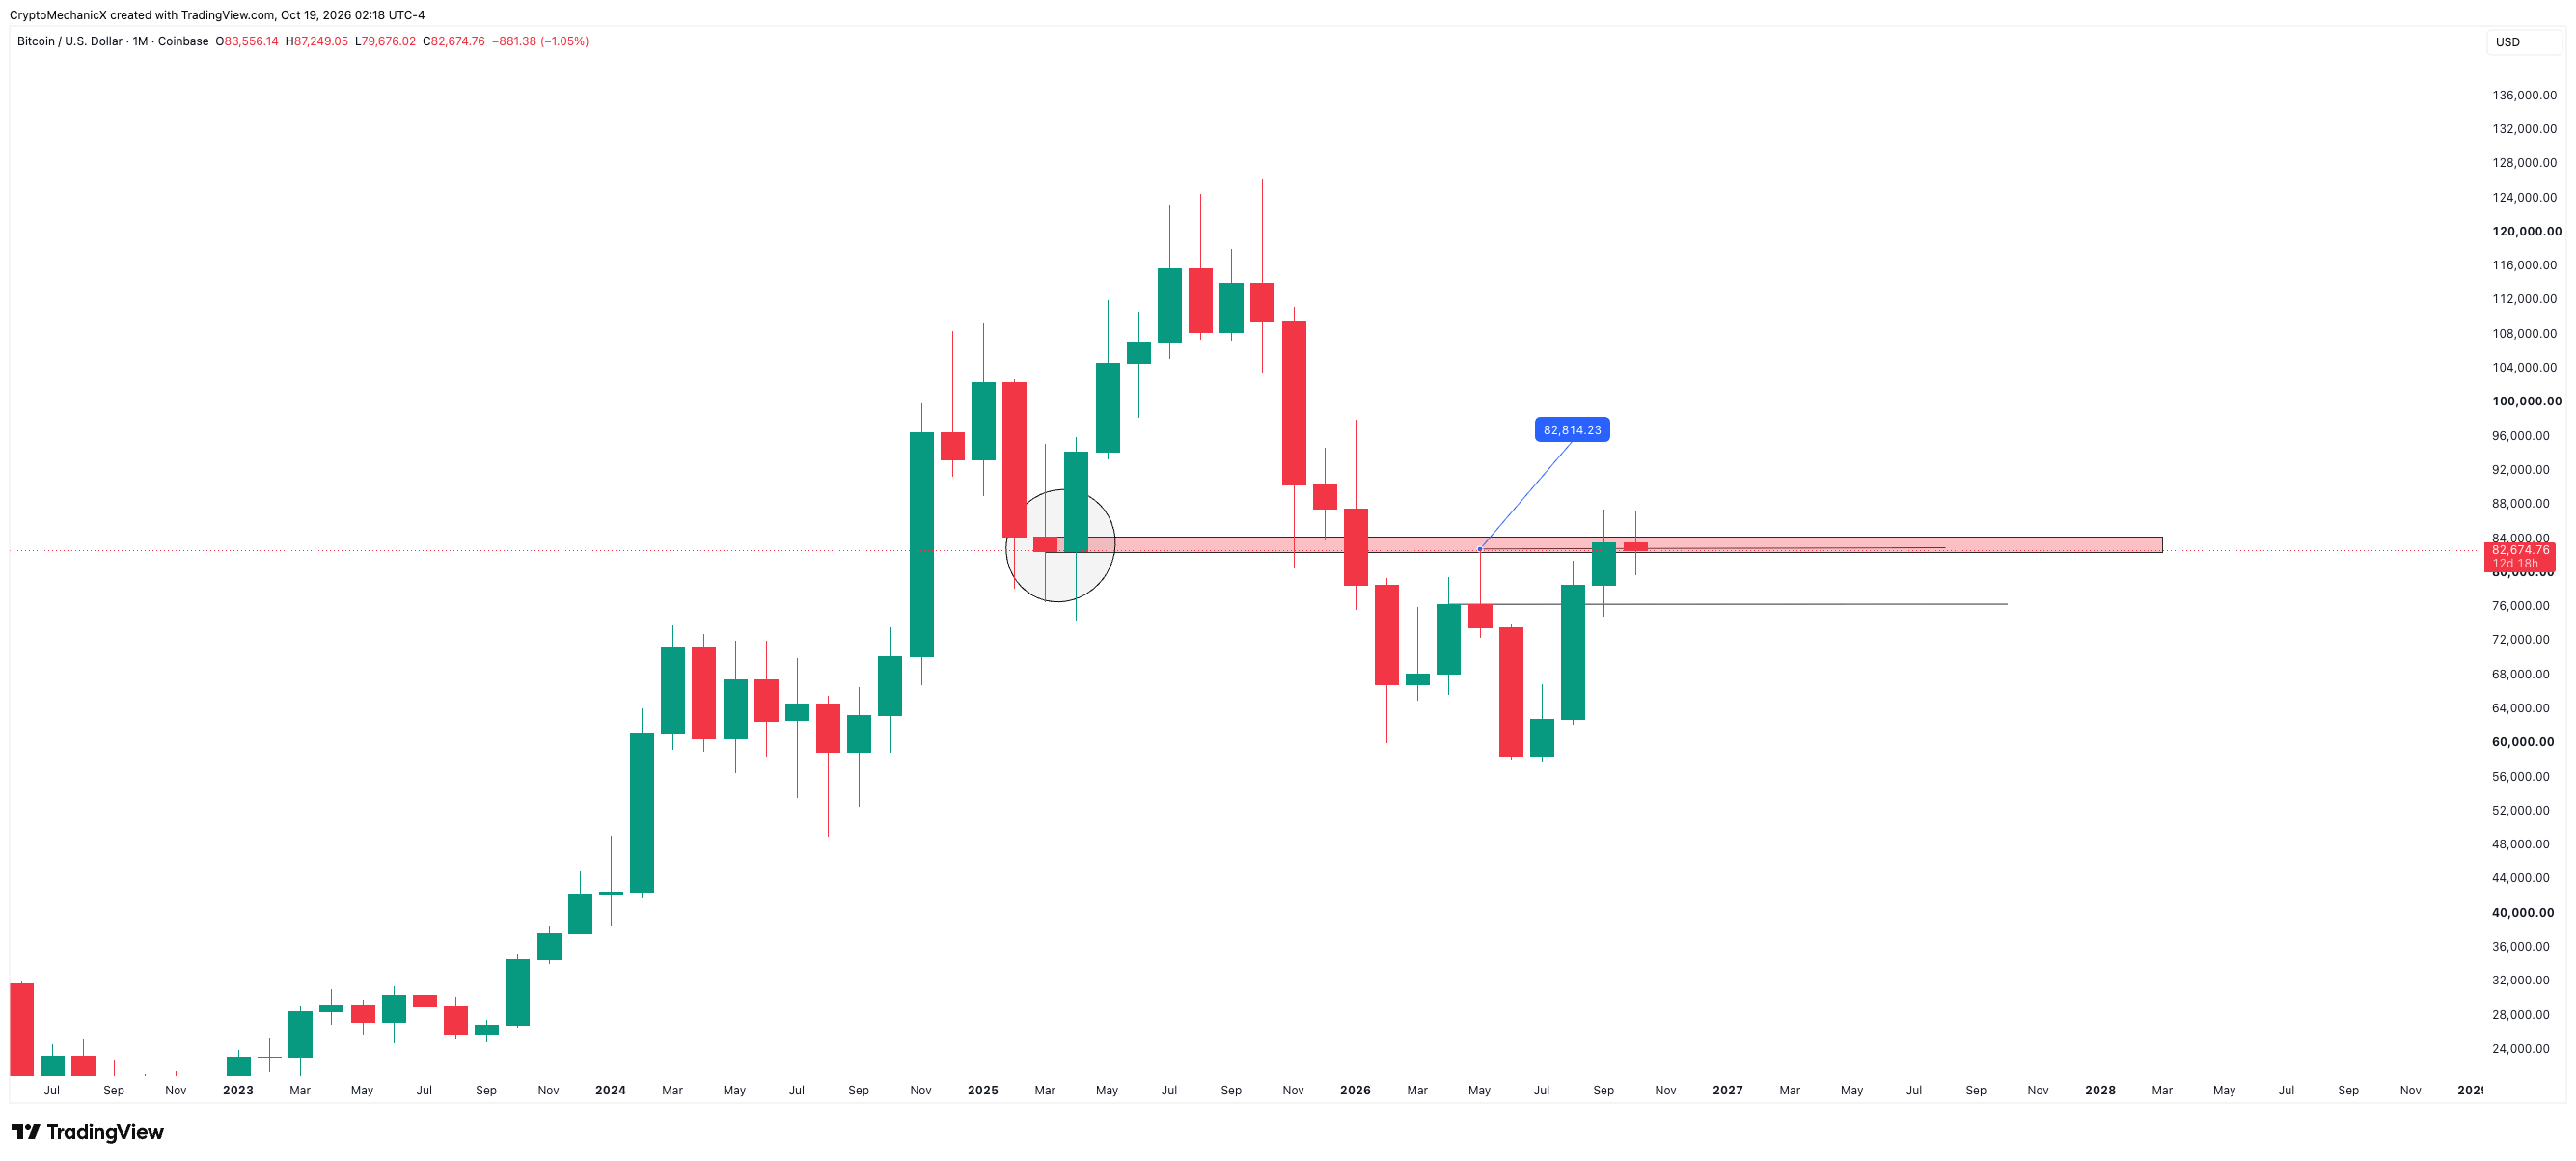
Bitcoin shifted its monthly structure when it closed a candle above $82,800. Some traders also use the candle body close, which was around $76,300, as a valid structural level. Personally, I use both, although most traders prefer to focus on the highs and lows.
The monthly structure has shifted, which means Bitcoin is no longer structurally in a bear market. We’ve discussed high-timeframe trend shifts before, so I won’t go into detail here.
Now, the $82,000–$84,000 zone, which I’ve marked on the chart, was previous support and has now turned into resistance. The interesting part is that Bitcoin shifted its monthly structure around the same level that is now acting as resistance.
However, once the market shifts its structure, resistance levels often become temporary as long as the new structure holds. Eventually, price can break through them.
For now, I think Bitcoin looks fine structurally as long as the monthly chart holds above $74,000–$76,000. The broader invalidation level is still the last low around $58,000, but that’s much further away. As long as the monthly structure remains intact, I expect Bitcoin to continue moving higher over time.
People are Impatient
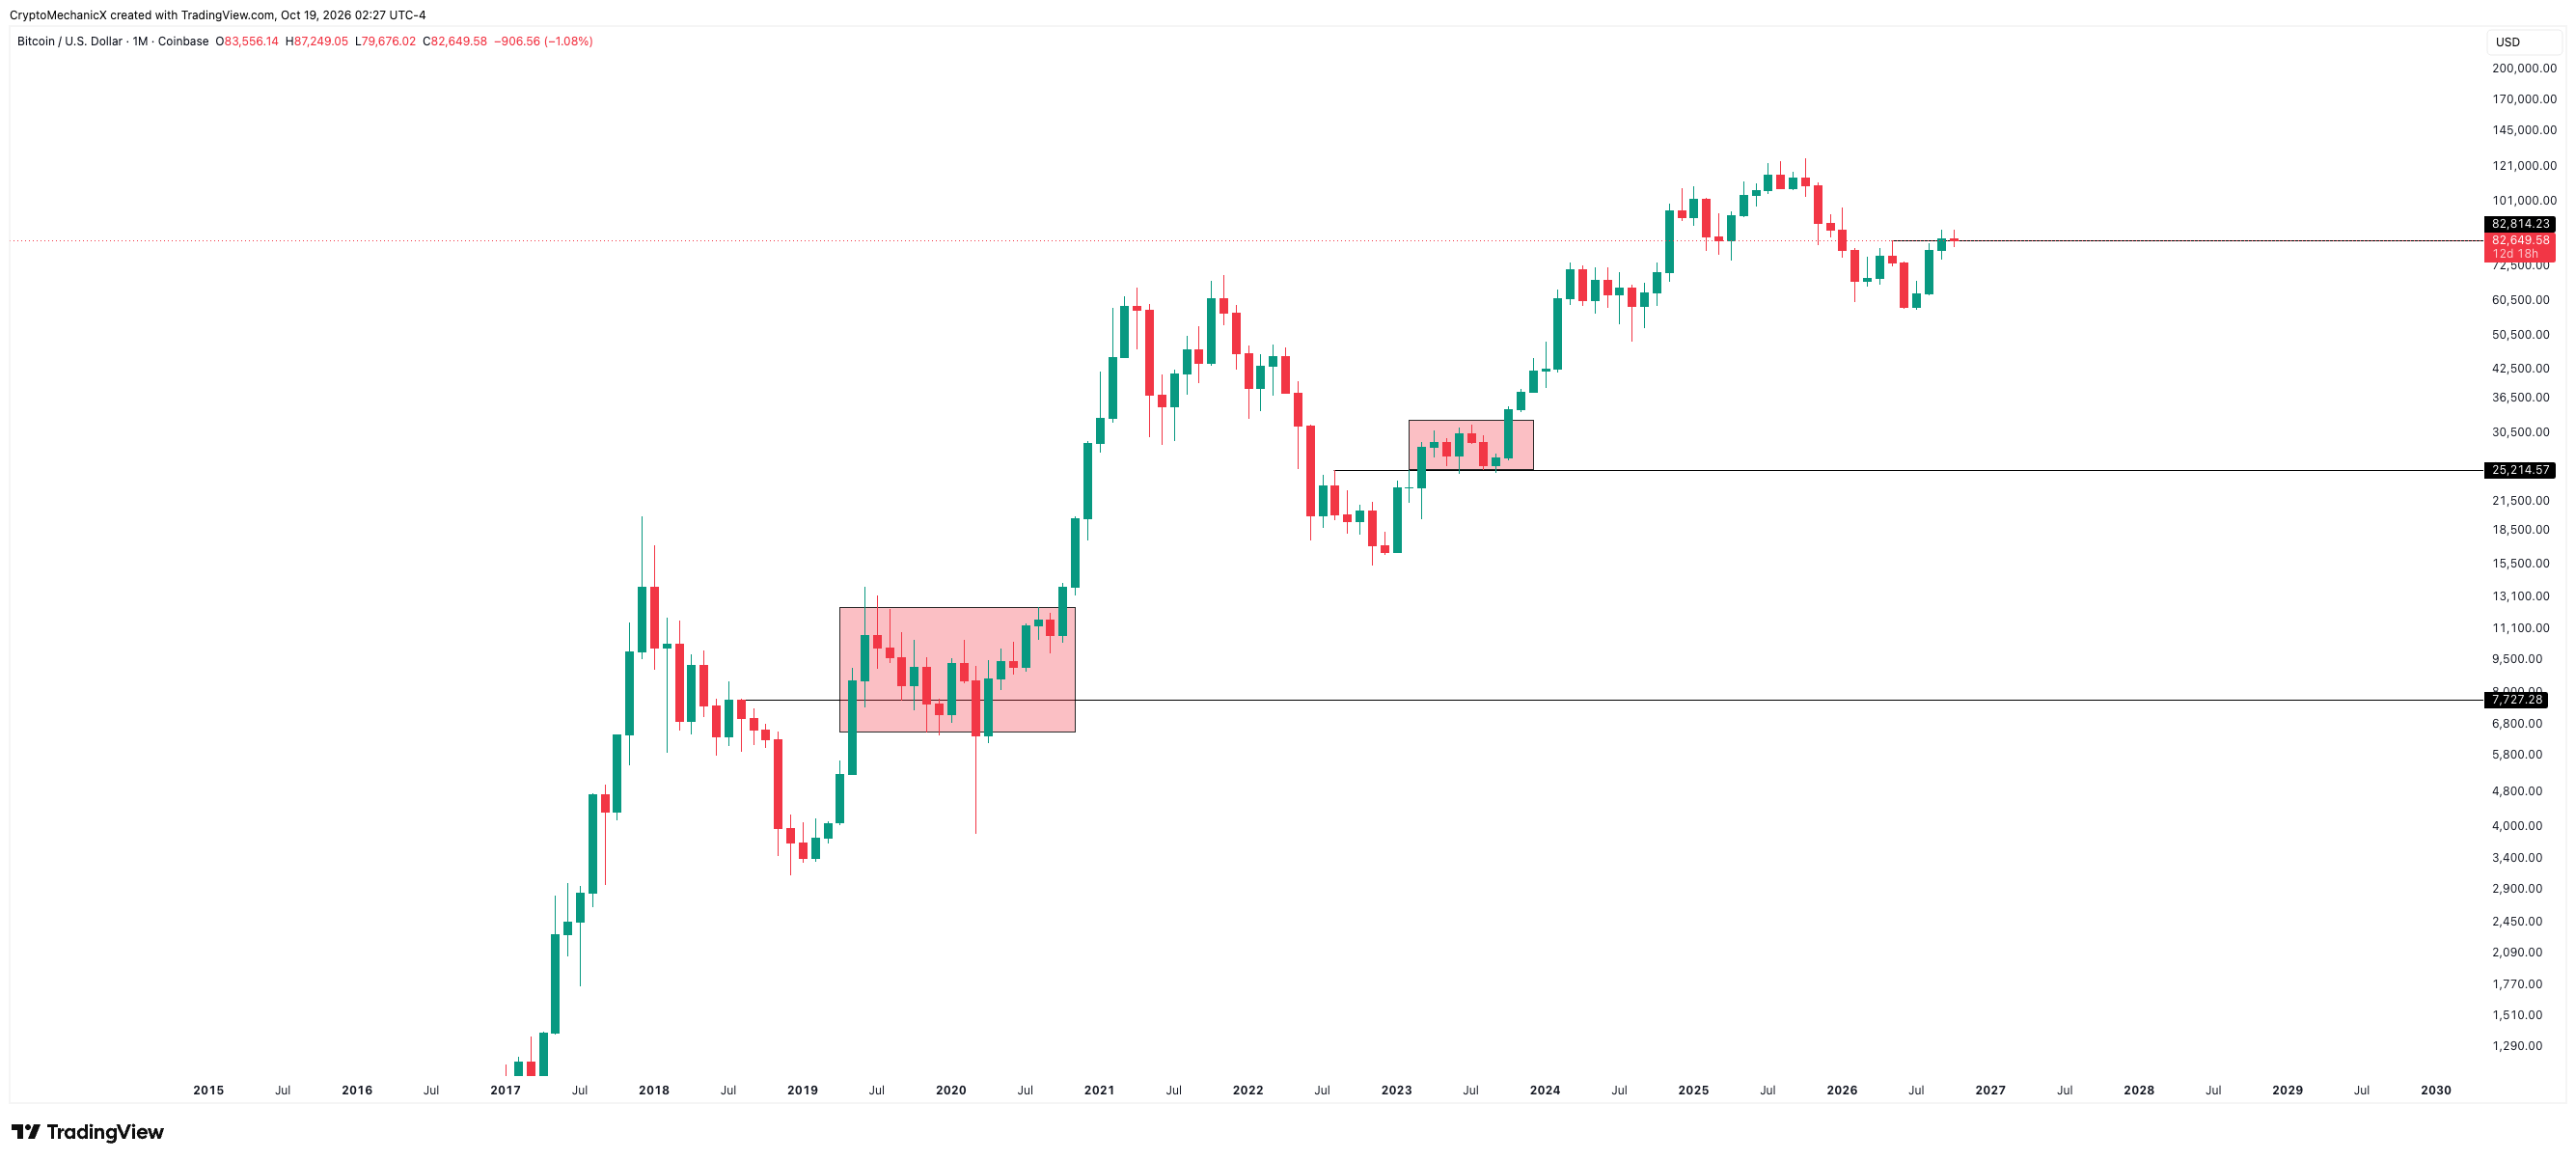
One thing I want to discuss here is that people are really impatient. They think that once the market structure shifts, price should just keep going up. But that’s not how it works.
A structure shift doesn’t mean price will keep moving higher immediately. It can take much longer than you expect, especially when we’re talking about a high-timeframe shift and Bitcoin has only recently come out of its bear market.
I’ve attached examples from the previous bear markets. When Bitcoin shifted its trend, both in the last bear market and in 2018, it spent months ranging before the next leg up began.
So understand one thing: price can take much, much longer than you expect to deliver the next leg higher. How patiently you can wait depends on how you manage yourself, control your emotions, and position yourself in the market.
02BTCUSD (Weekly)
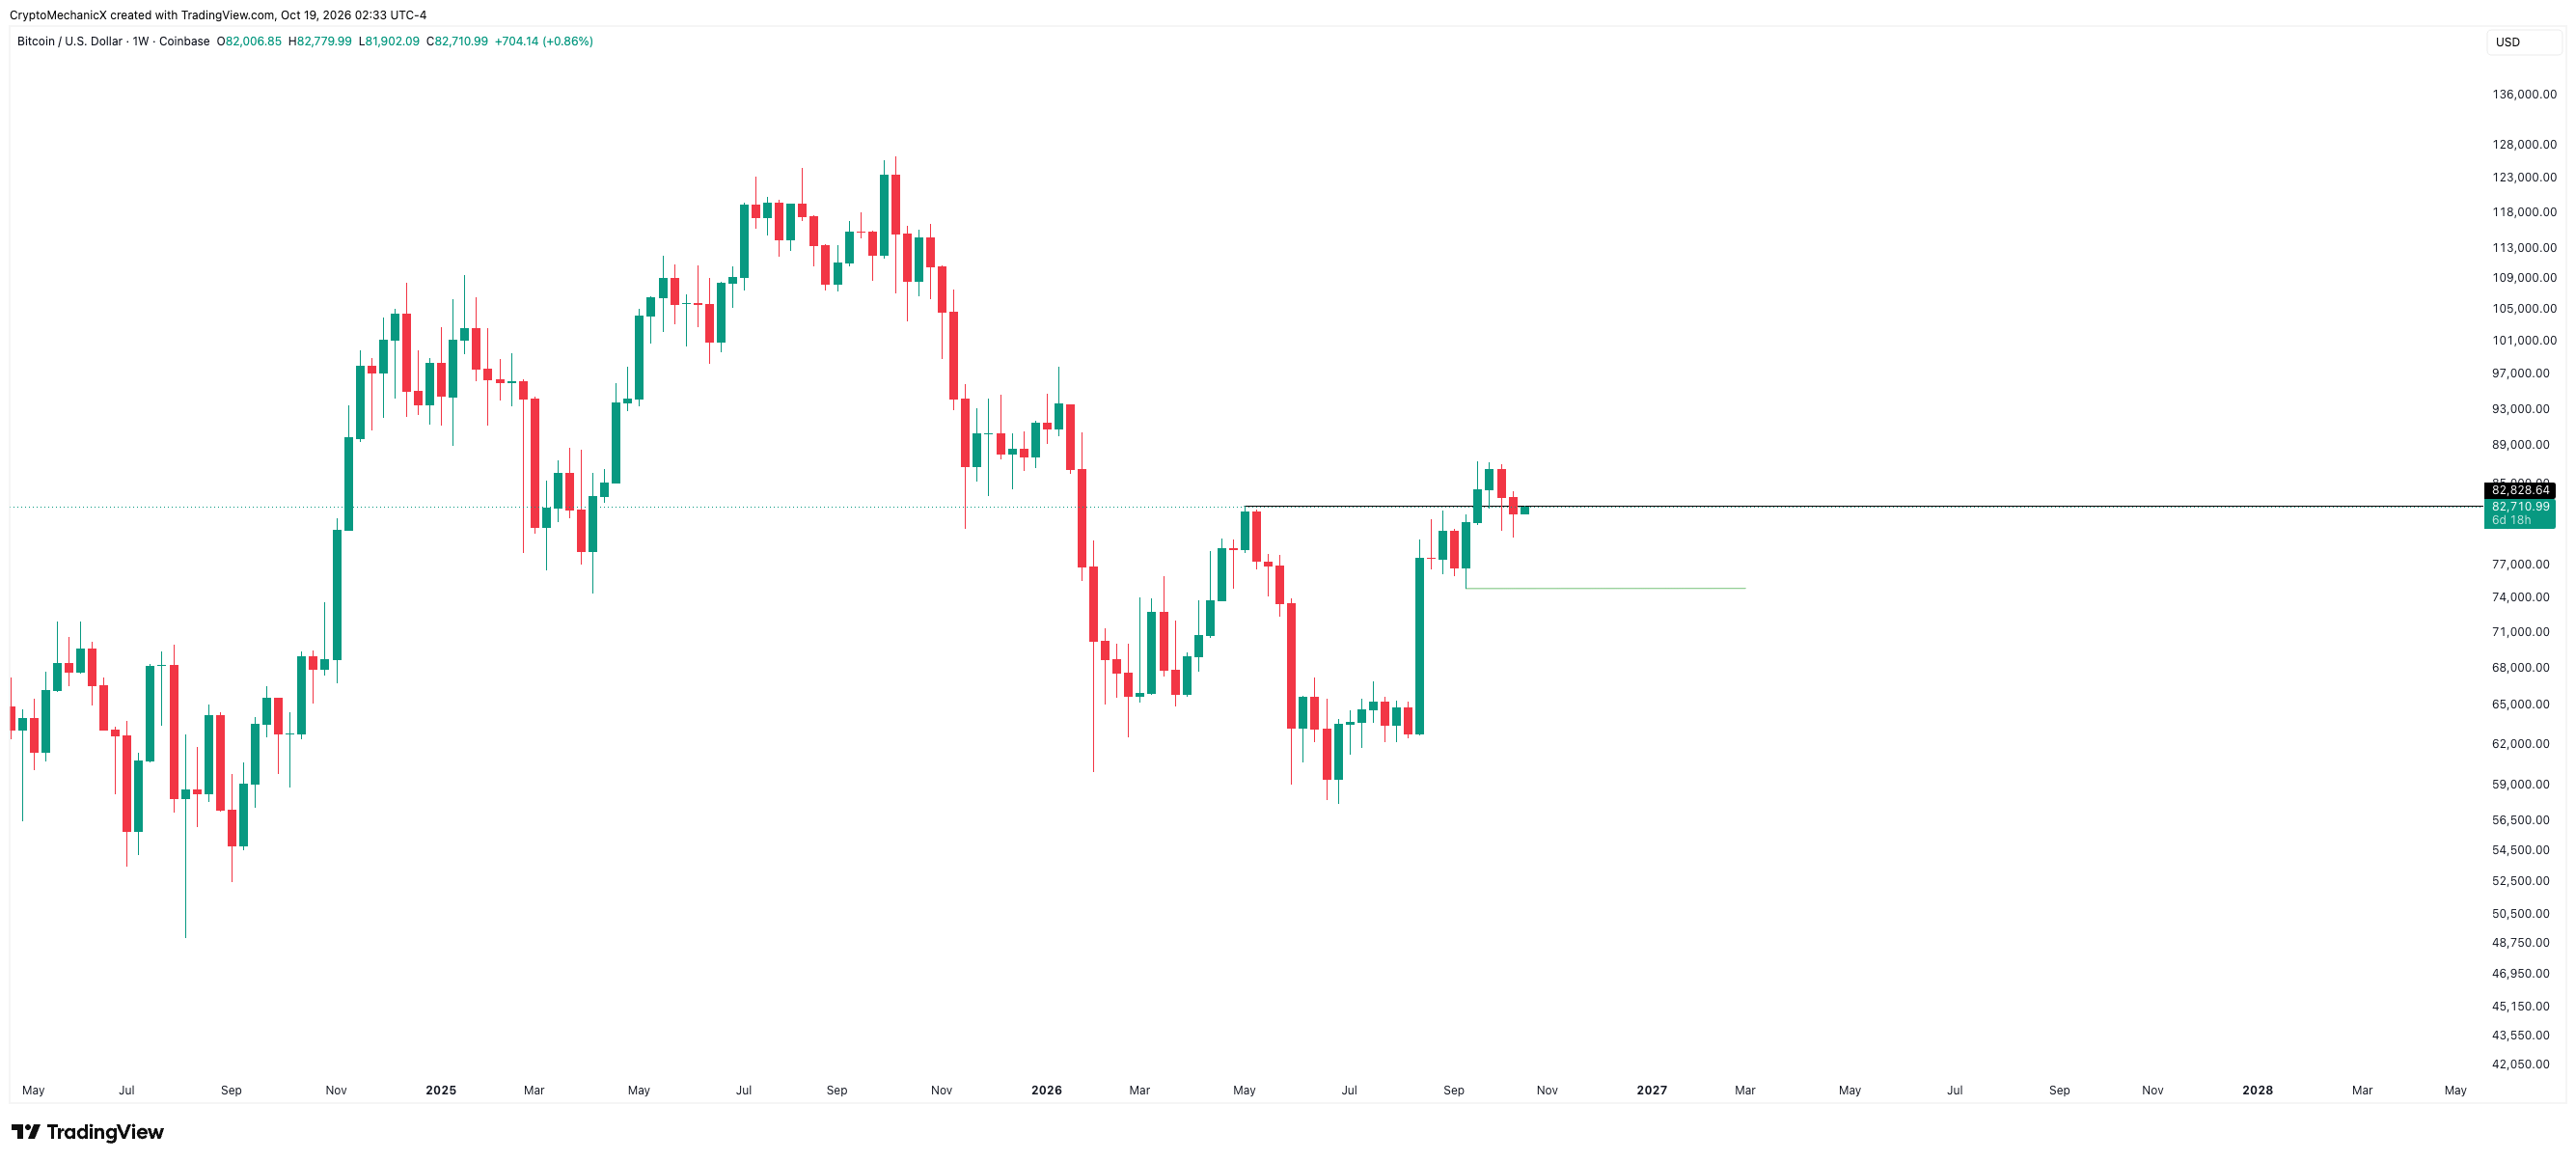
Structurally, the weekly chart is bullish as well. Bitcoin broke its last lower high around $82,800, confirming the structure shift.
As long as the structure holds, pullbacks are perfectly fine. The key level to watch is $75,000, which is the last low on the weekly chart. As long as Bitcoin holds above that level, I think the weekly structure remains intact.
The weekly fake-out
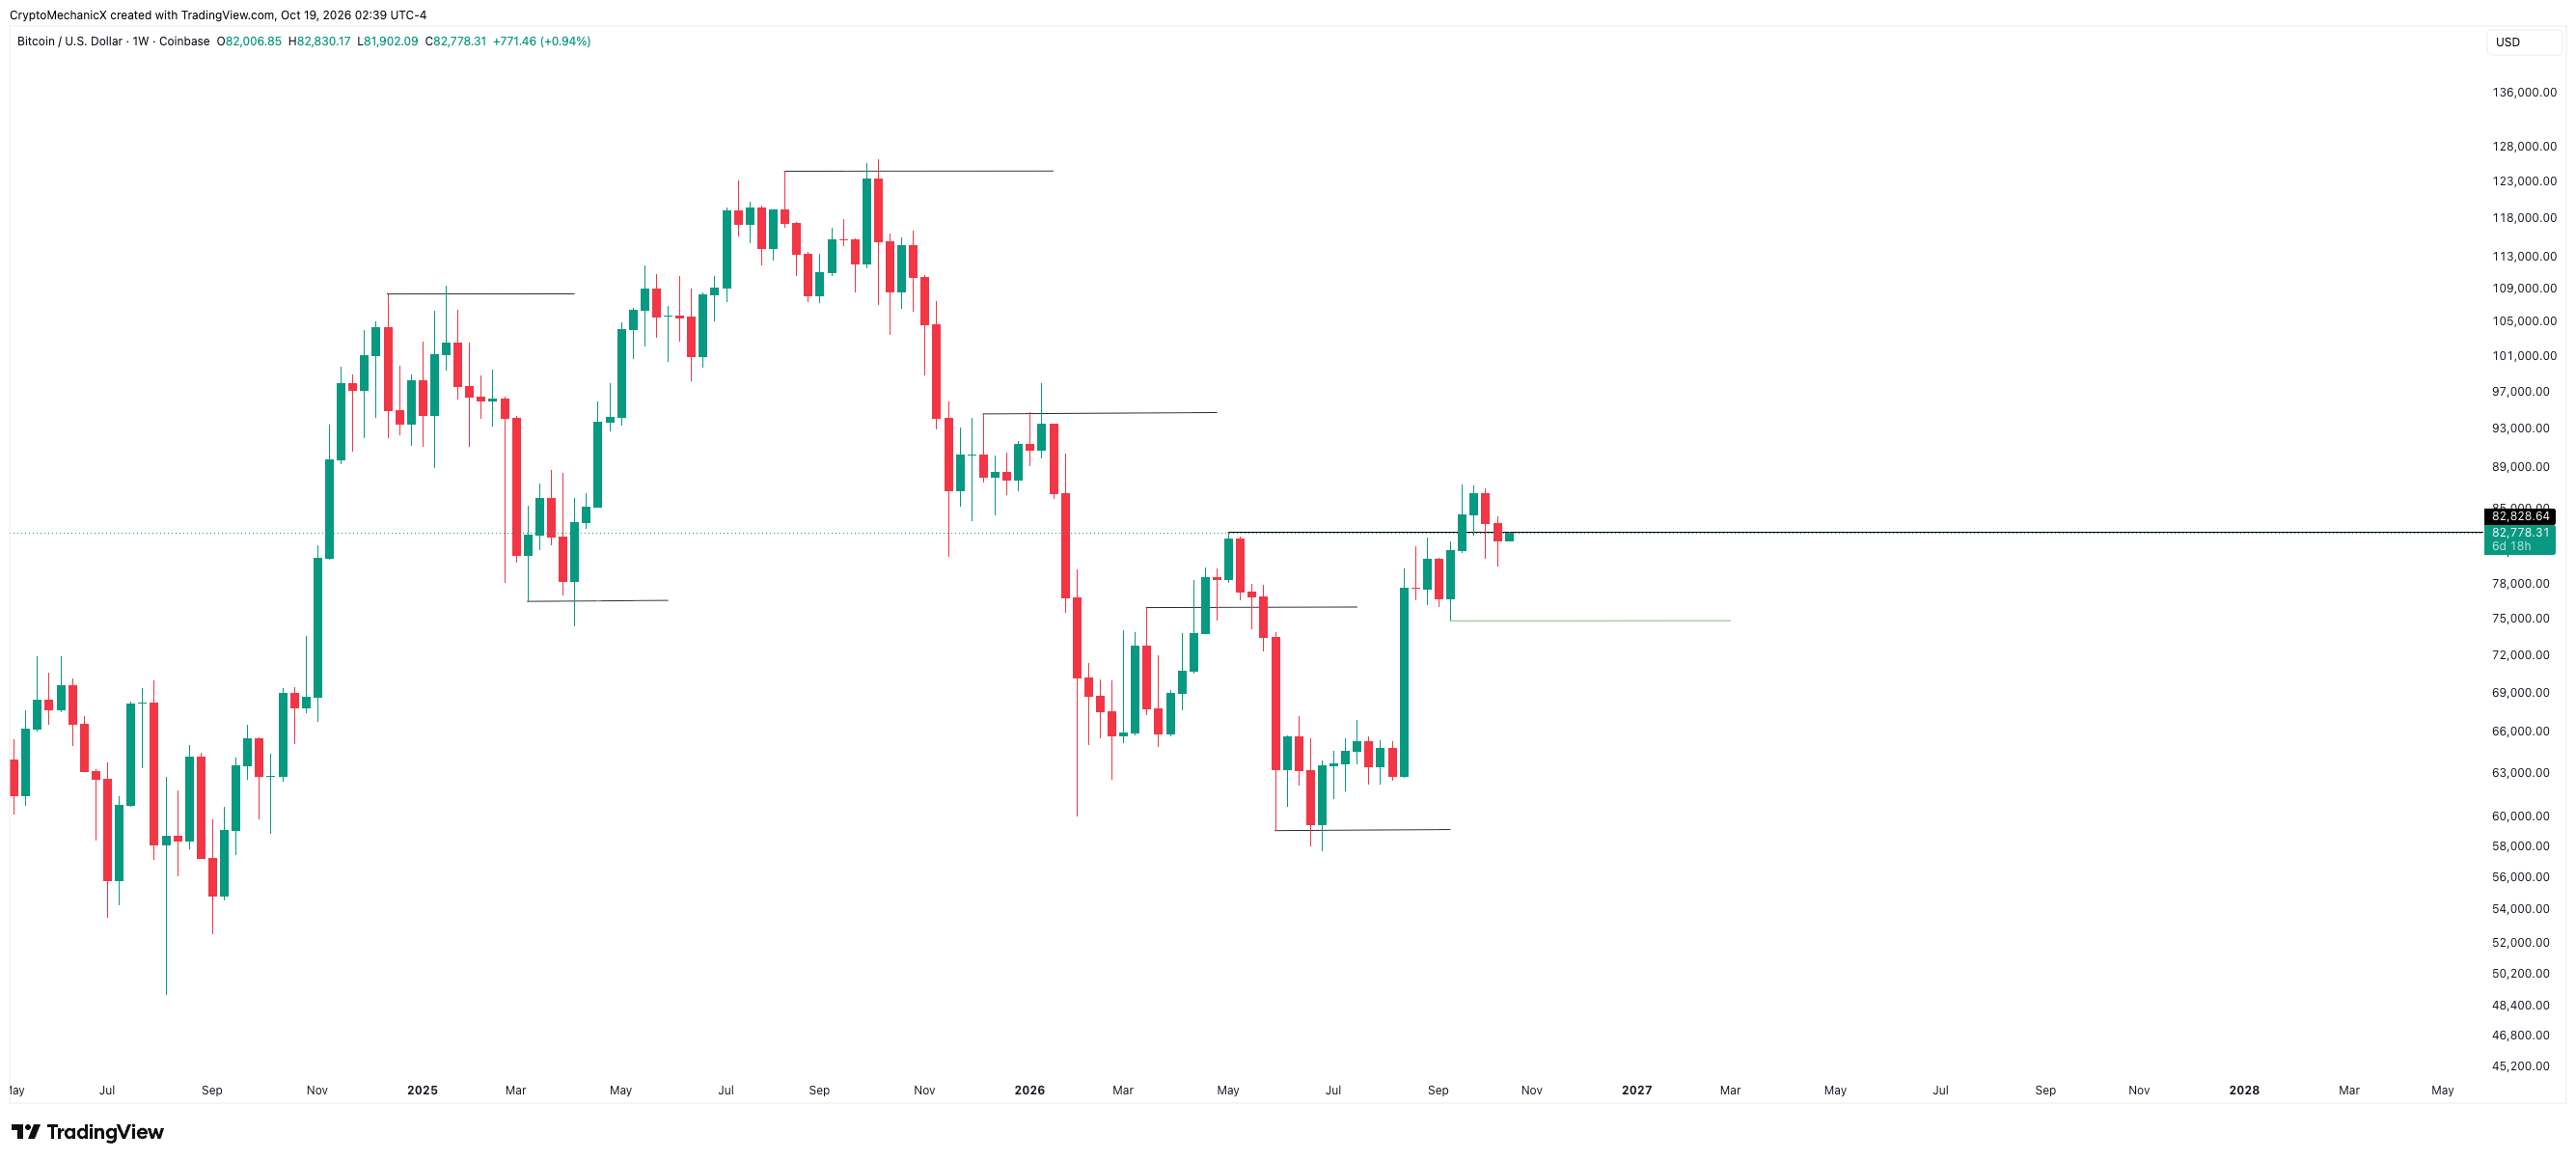
Now, here’s the twist. While the weekly chart is still bullish structurally, we also have a weekly fakeout to deal with.
Bitcoin broke above $82,800, held above it for some time, but has now closed back below that level. This is what we call a fakeout: price breaks out of a level but fails to sustain the breakout.
I’ve marked the previous weekly fakeouts on the chart. Most of those were SFPs, where price briefly broke a high or low and quickly closed back inside. This one is slightly different because Bitcoin spent some time closing above the level before moving back below it.
So now we’re caught between two technical signals: a weekly fakeout, which could be a short-term bearish signal, and a bullish market structure, which is a higher-timeframe development.
As I mentioned at the beginning of this article, I believe we’re in the early stages of a bull market. Personally, I give more weight to the fakeout for my short-term trading decisions. It’s part of my trading strategy: when I identify a fakeout, I consider taking exits from existing positions or looking for entries based on that setup.
So, this is a concern in the short term. However, if you’re playing the long-term game and looking to accumulate Bitcoin, this may not be a major concern for you.
For the short-term outlook, Bitcoin needs to move back above $82,800 and sustain that level to invalidate the fakeout. Ideally, price should move away from this level and establish itself above it.
Weekly fakeouts are particularly reliable on Bitcoin. Historically, when a weekly fakeout occurs in either direction, price tends to trend in the opposite direction. I’ve marked the previous examples on the chart, so you can see how this has played out.
Why I am not concerned for this fake-out
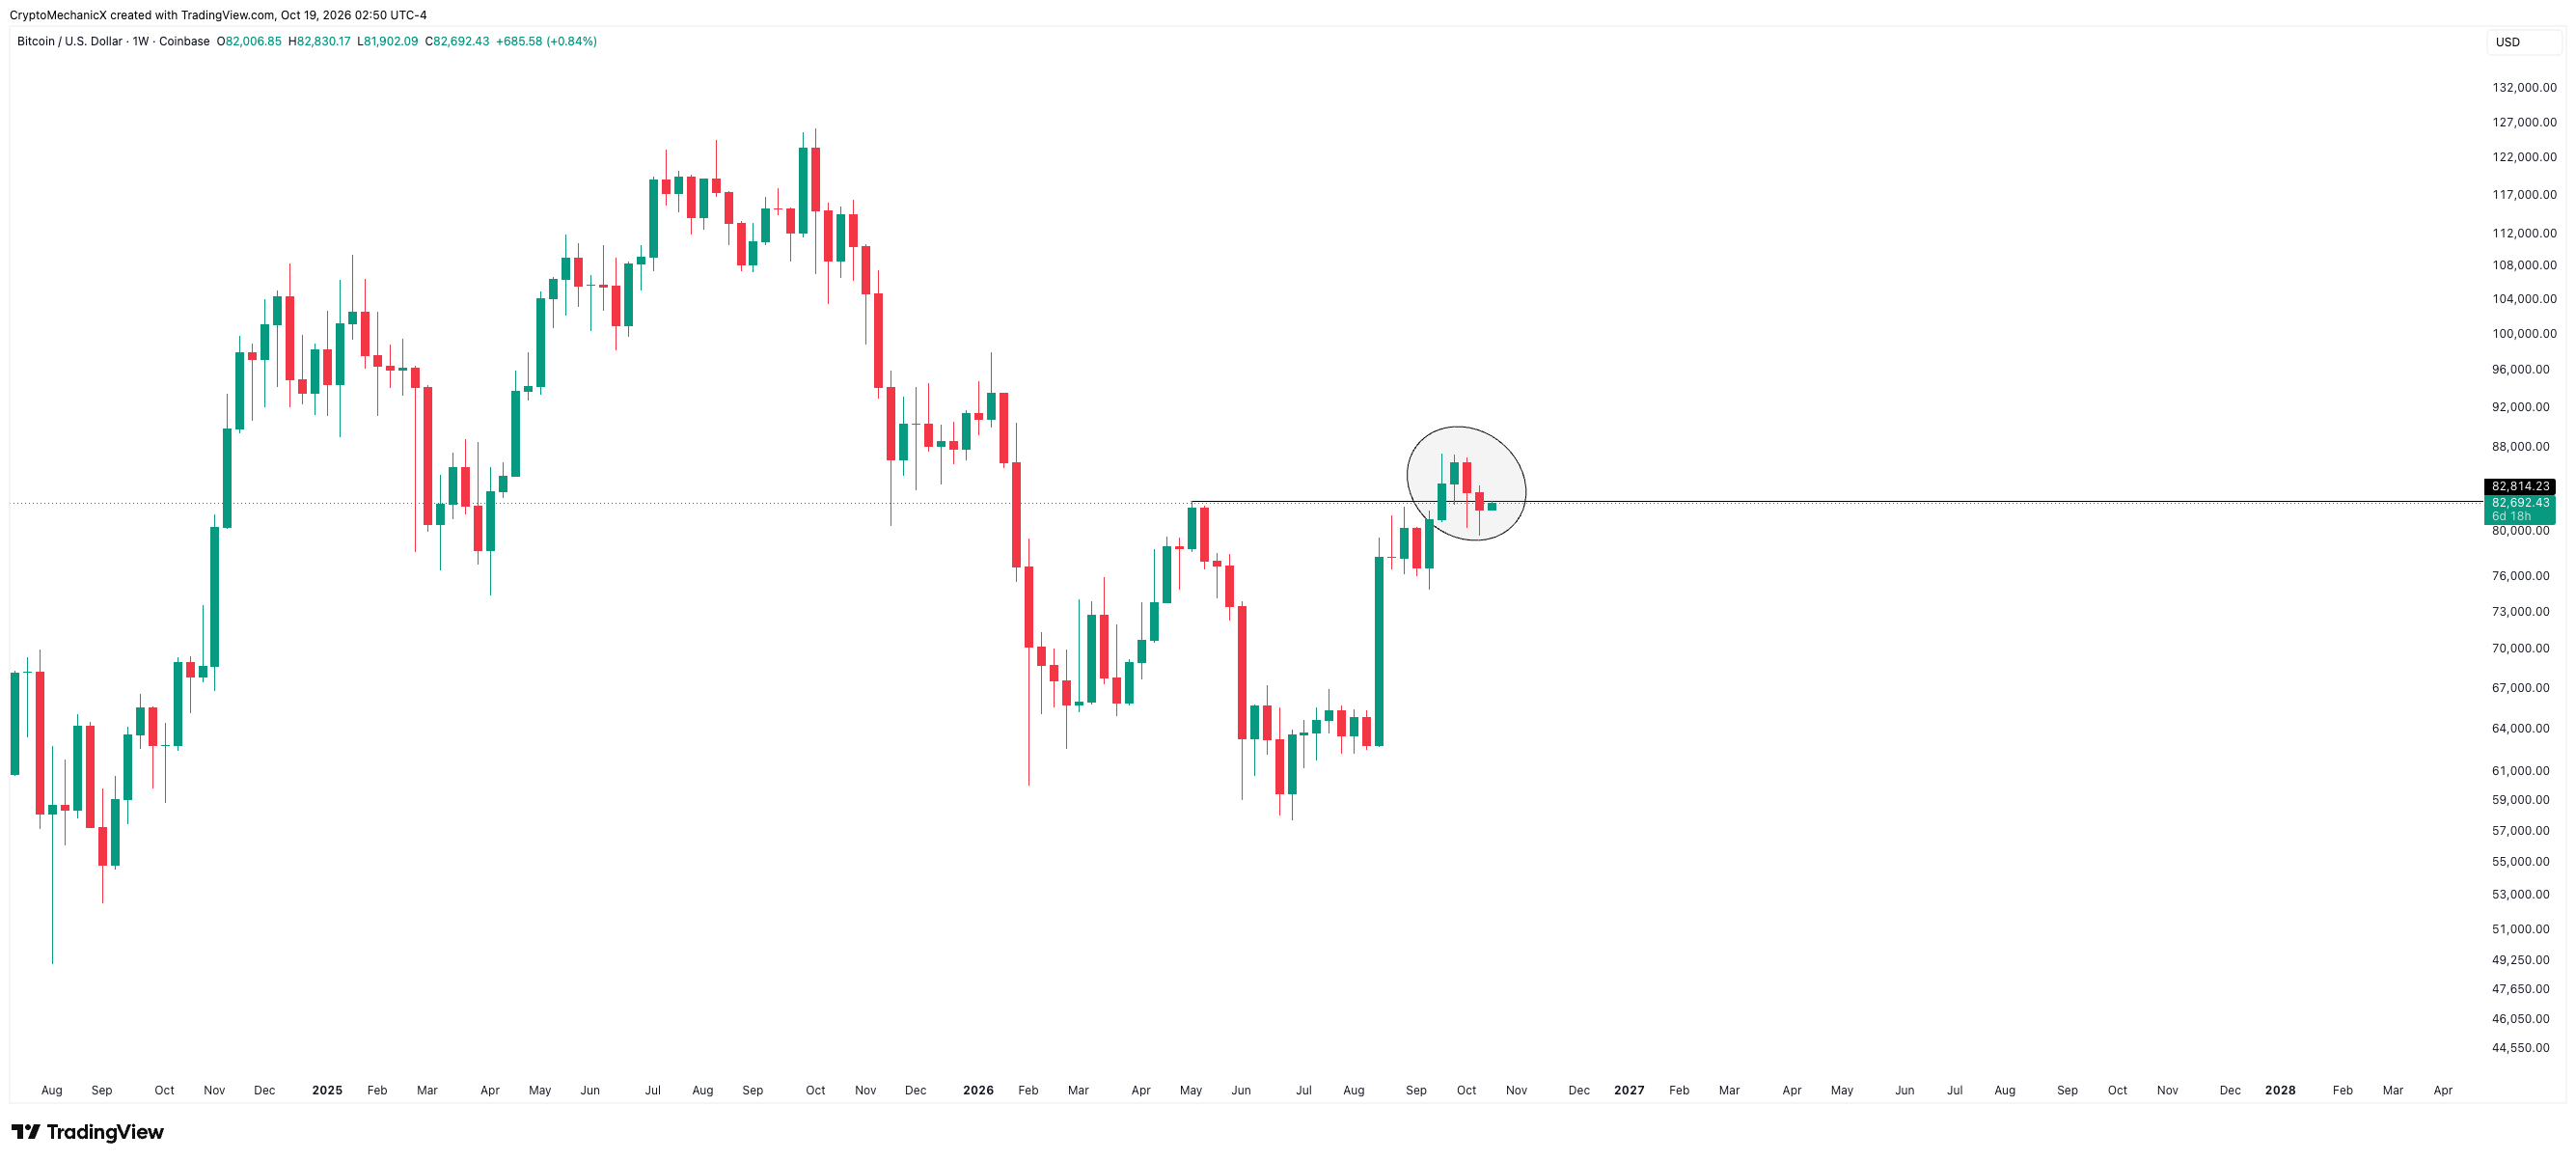
Personally, I’m not too concerned about this fakeout, and there are two main reasons for that.
First, I think we’re in the early stages of the bull market. As I showed in the earlier charts, Bitcoin has historically taken months after a high-timeframe structure shift to deliver its next leg up. Since I’m positioning myself for the next cycle rather than short-term moves, any discount would be an opportunity for me to accumulate more BTC.
Second, the current downside seems to be driven more by macro factors than by Bitcoin-specific weakness. Stocks are falling, the DXY and oil prices are rising, and inflation remains a concern. Bitcoin is being dragged down by broader market conditions rather than showing significant weakness of its own.
If Bitcoin were showing significant weakness of its own, accompanied by heavy selling, I would be more concerned. But the candle that closed back below the breakout level is relatively weak, rather than showing a strong sell-off.
Of course, I could be wrong about the early bull market outlook, but for now, I’m more focused on higher-timeframe structure than short-term fakeouts.
03BTCUSD (Daily)
At the start of October, I said it would be more of a Choptober than an Uptober.

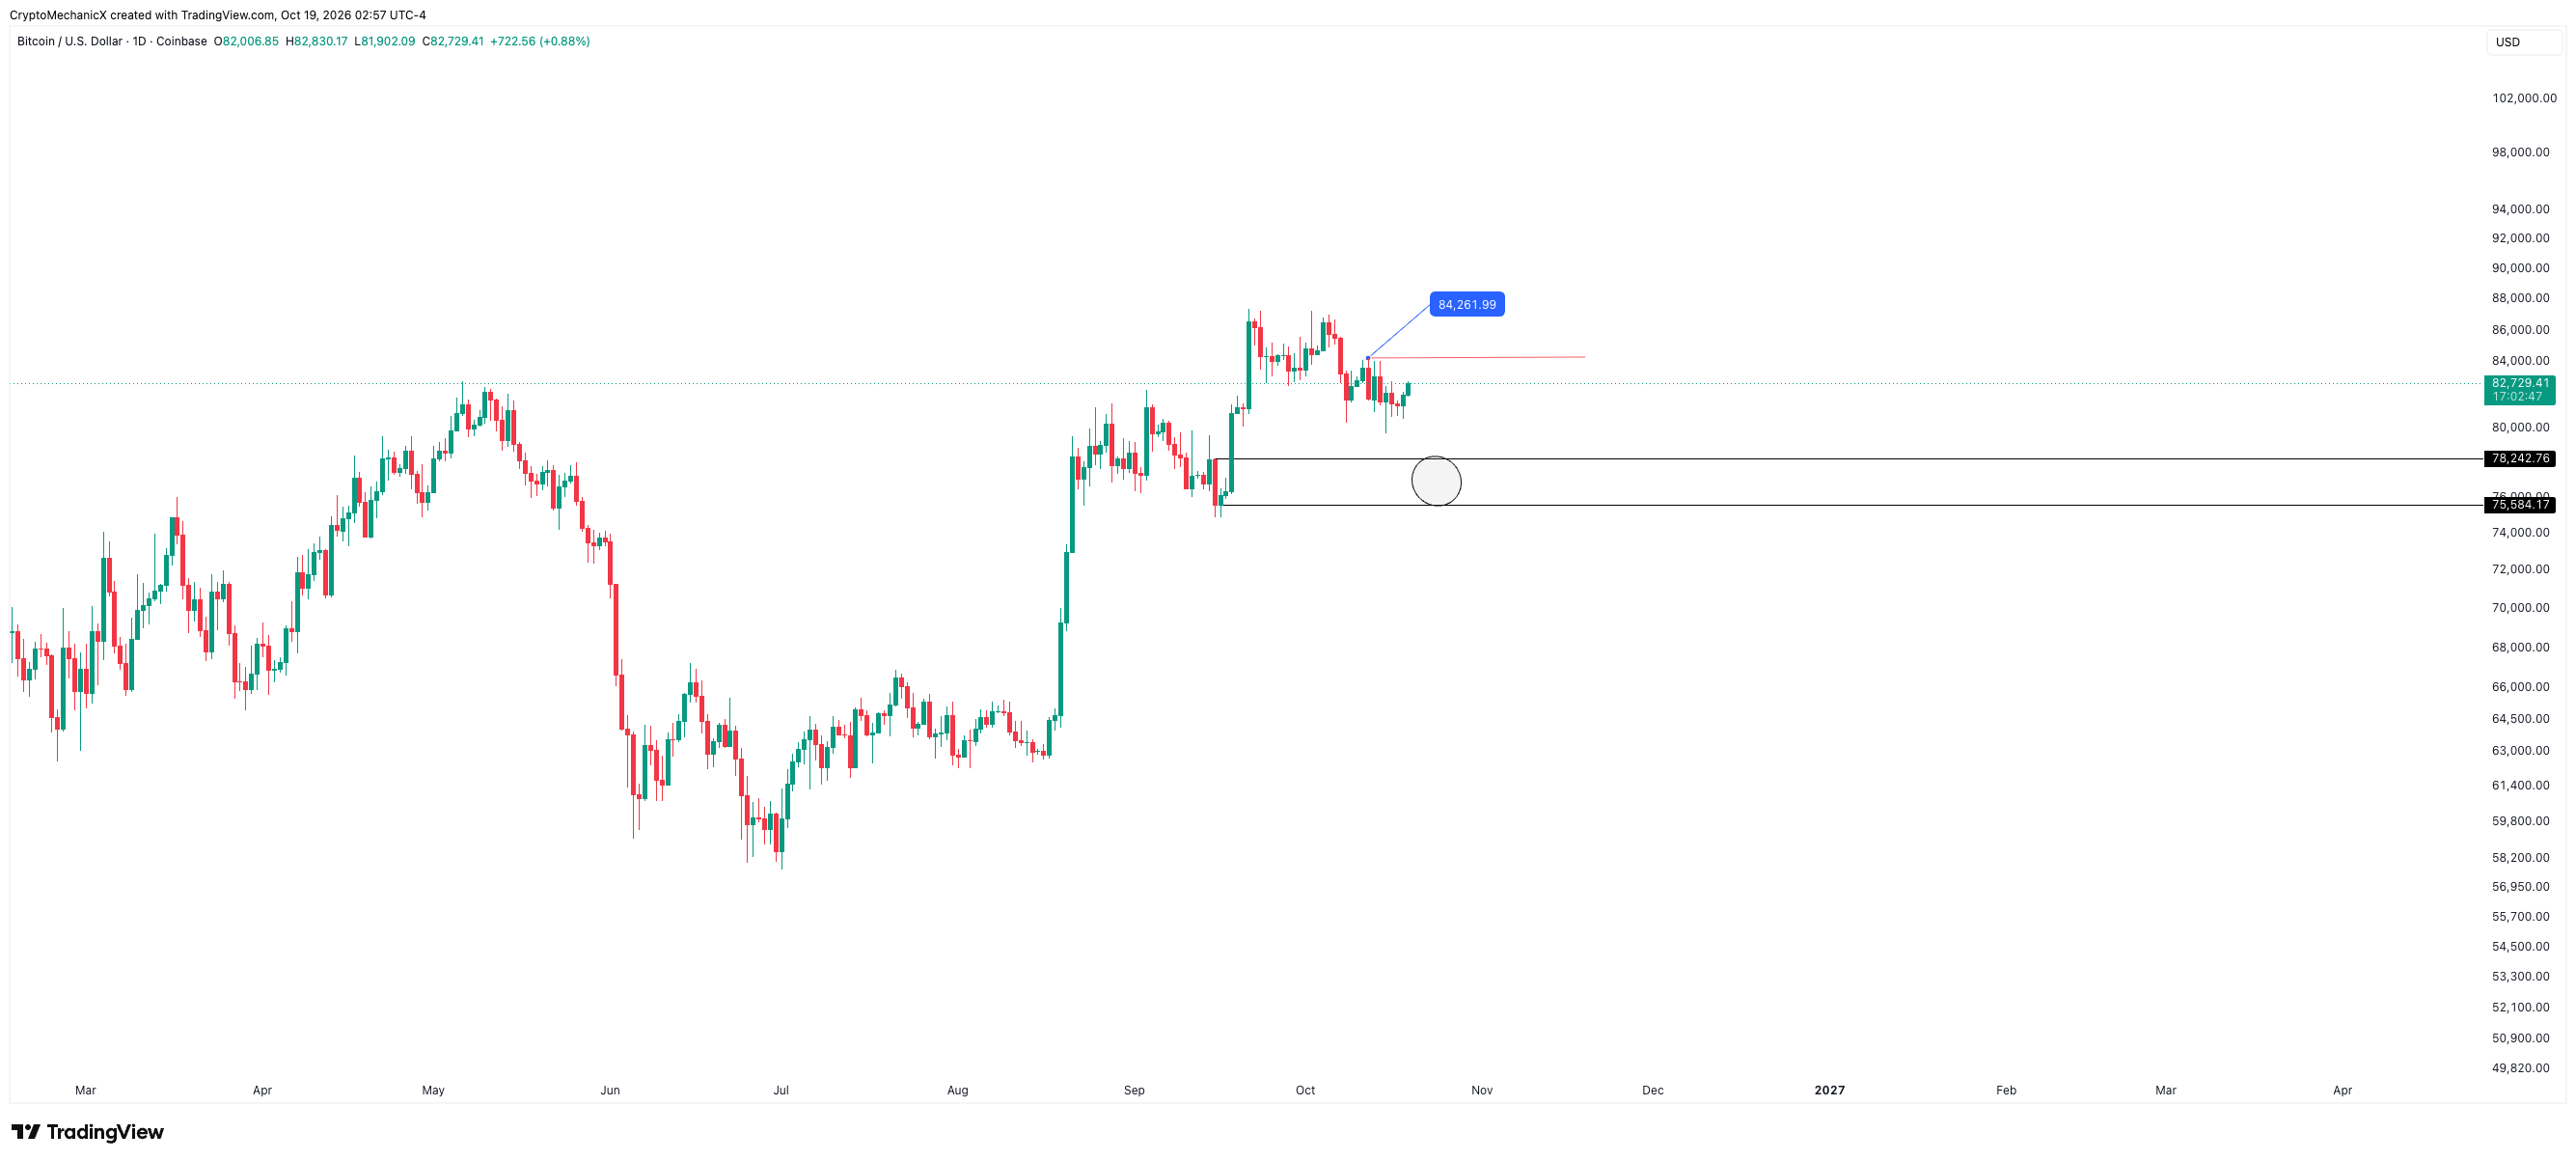
I also mentioned that the only good trade setups I see on BTC based on the daily chart are either a move below $80,000 or a breakout above $84,000 with price holding above that level.
My view remains the same. The daily chart is still chopping, and you don’t want to get stuck in lower-timeframe noise. I think better trading opportunities will emerge either below $80,000 or above $84,000.
That’s pretty much it for my Bitcoin high-timeframe update.
I think this week is particularly important, both in terms of macro factors and how the stock market performs, and because we now have a weekly fakeout, with Bitcoin closing back below its previous swing high.
We need to see how price reacts from here. Further downside would suggest the fakeout is playing out, while a move back above $84,000 would support the idea that Bitcoin is being dragged down primarily by broader macro conditions.
In my opinion, we should get a clearer picture this week, so it’s going to be an important one.
Good luck!
Originally published by CryptoMechanic on Binance Square · October 19, 2026.
Build your trading knowledge
Learn market structure, Order Flow and risk management with our free course and community.